

Microsoft 77-728 - Excel 2016 Expert: Interpreting Data for Insights
Exhibit:
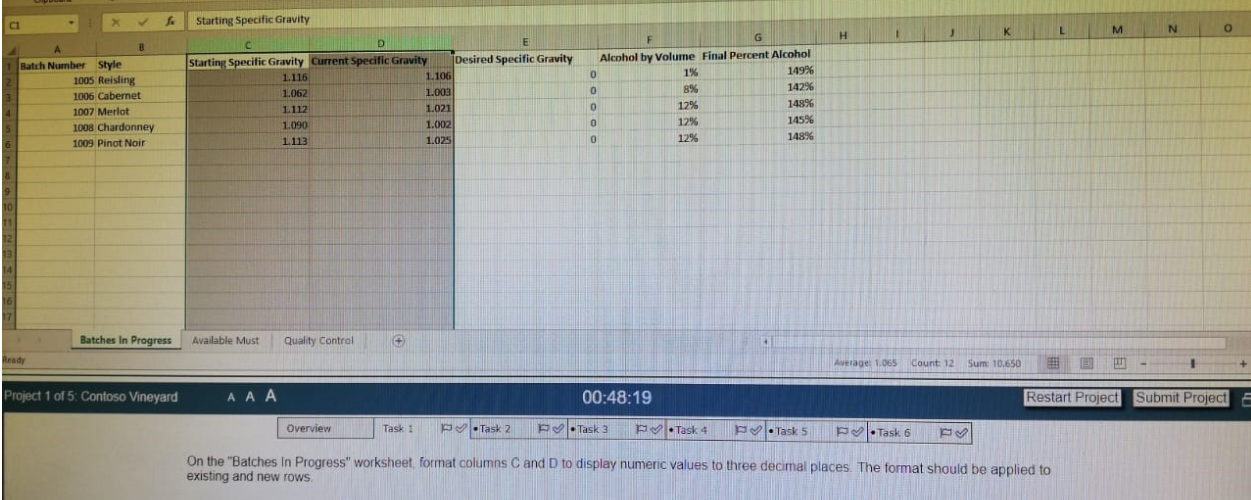
Task 1:
On the “Batches in progress†worksheet format columns C and D to display numeric values to three decimal places. The format should be applied to existing and new row
Exhibit:
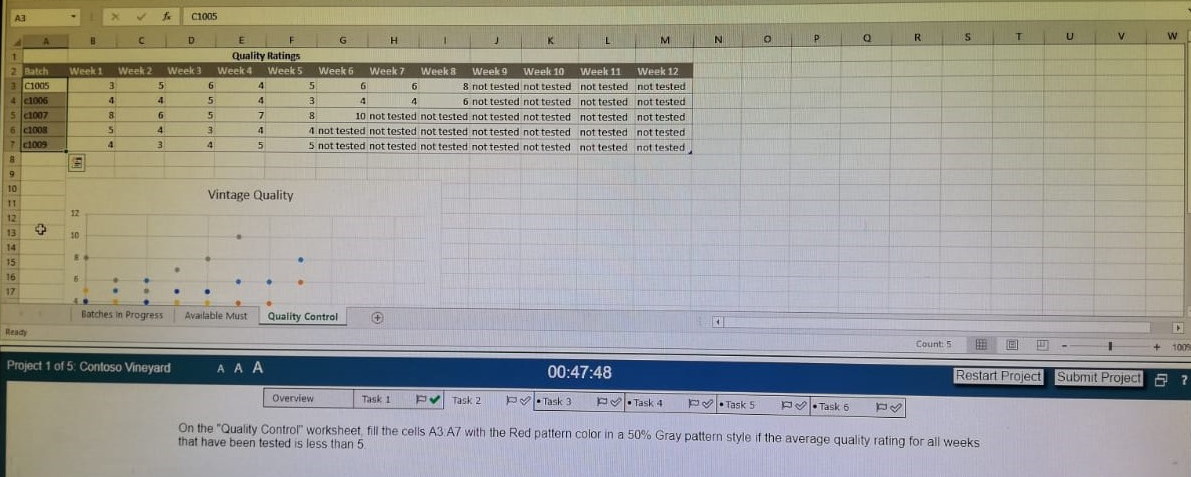
Task 2:
On the “Quality Control†worksheet fill the cells A3:A7 with the Red pattern color in a 50% Gray pattern styleif the average quality rating for all weeks that have been tested is less than 5.
Exhibit:
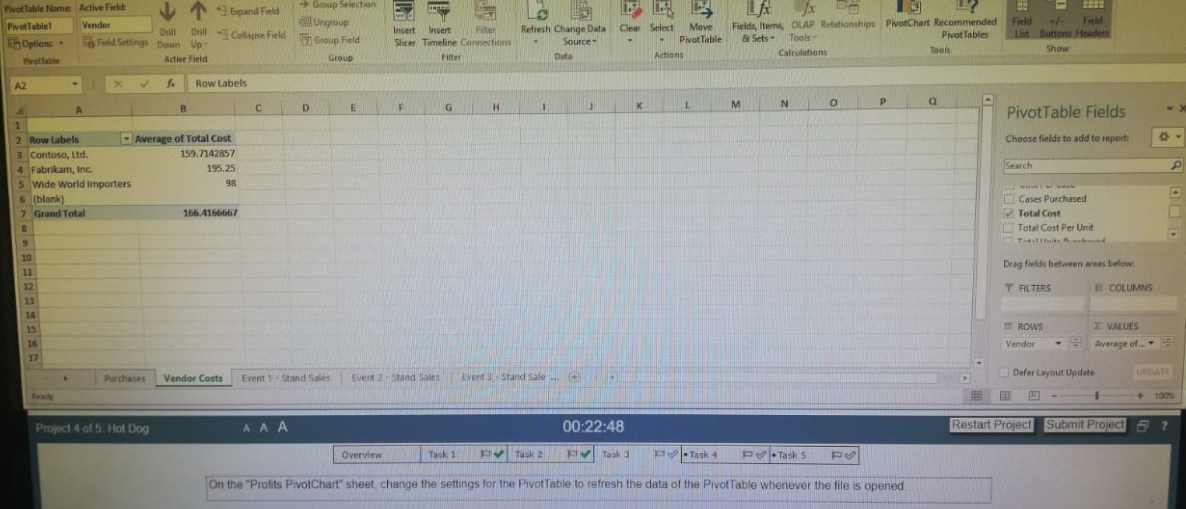
You are an accountant for an event stadium. You have created a workbook to keep track of the four vendors that are available at the stadium.
Task3:
On the “Profits PivtChart†sheet change the settings for the PivotTable to refresh the data of the PivotTable whenever the file is opened
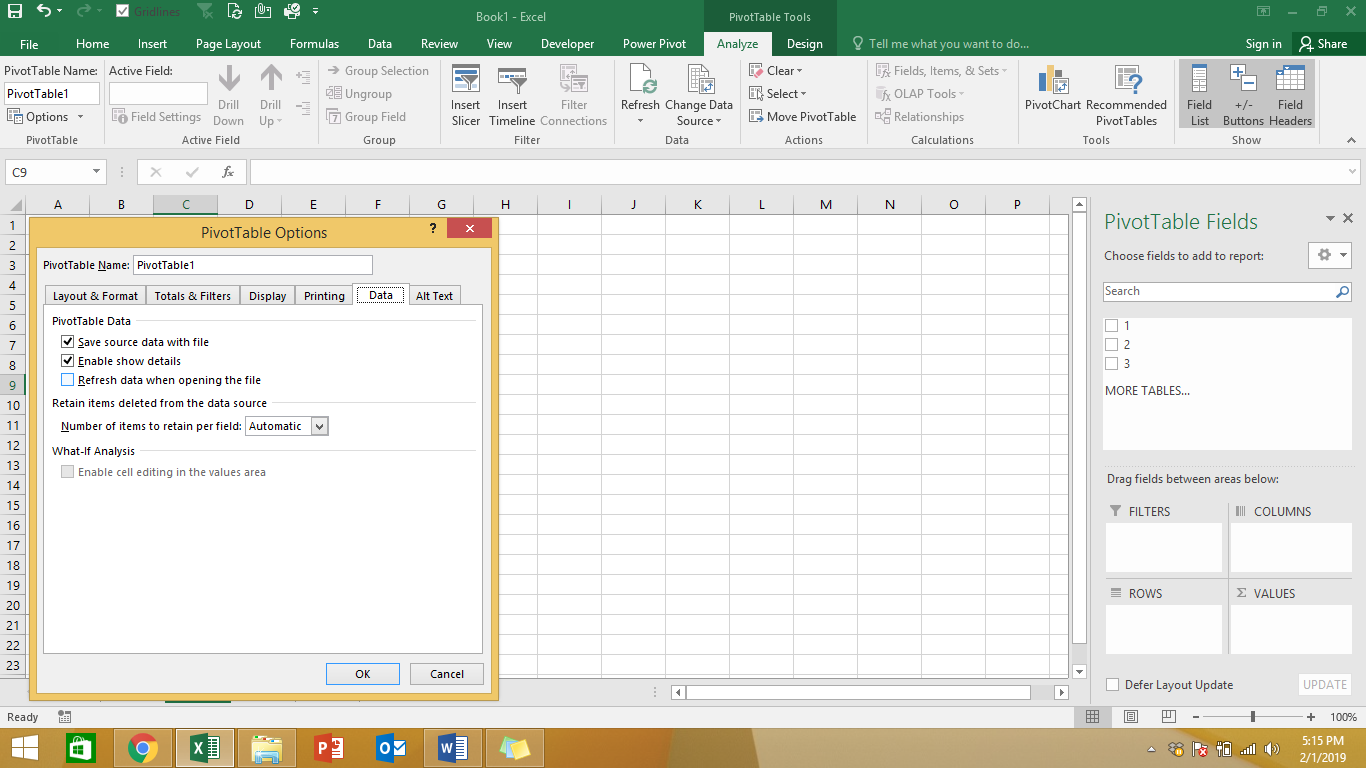
Exhibit:

You are an accountant for an event stadium. You have created a workbook to keep track of the four vendors that are available at the stadium.
Task 5:
Exhibit:
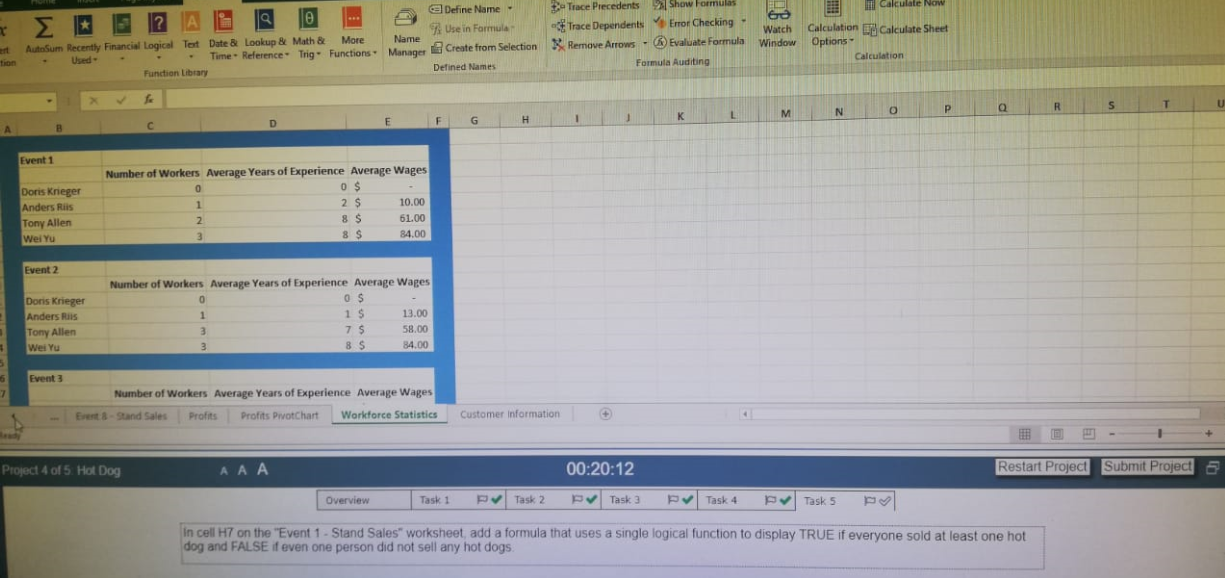
In cell H7 on the “Event 1 -Stand Sales†worksheet, add a formula that uses a single logical function to display TRUE if everyone sold at least on hot dog and FALSE if even one person did not sell any hot dogs.
Exhibit:
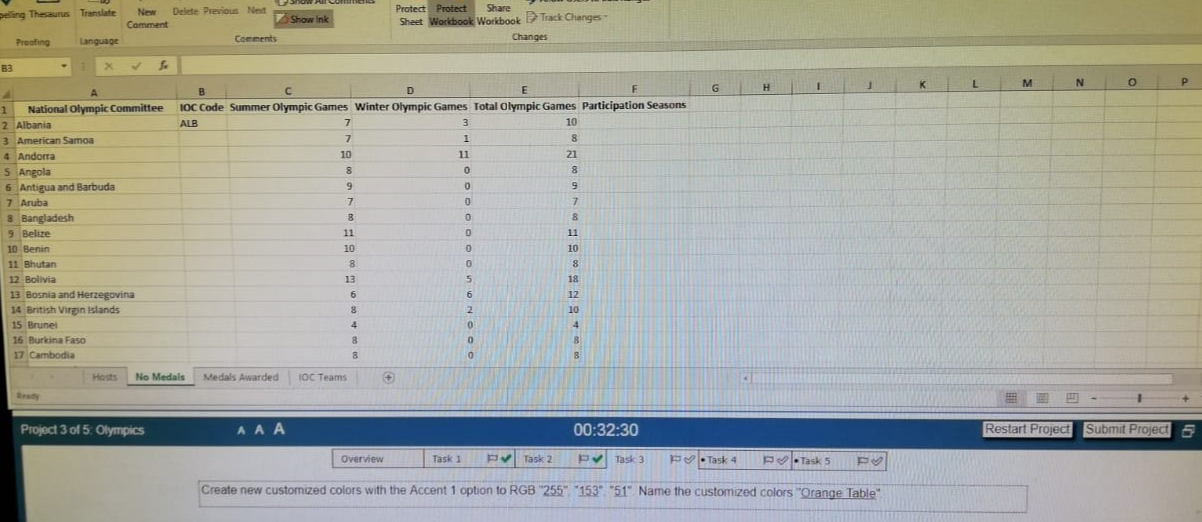
You are a news reporter. You have a been given the assignment to give a history of the Olympic Games.
Task3:
Create new customized colors with the Accent 1 option to RGB “255â€, “153â€, “51â€. Name the customized colors “Orange Tableâ€
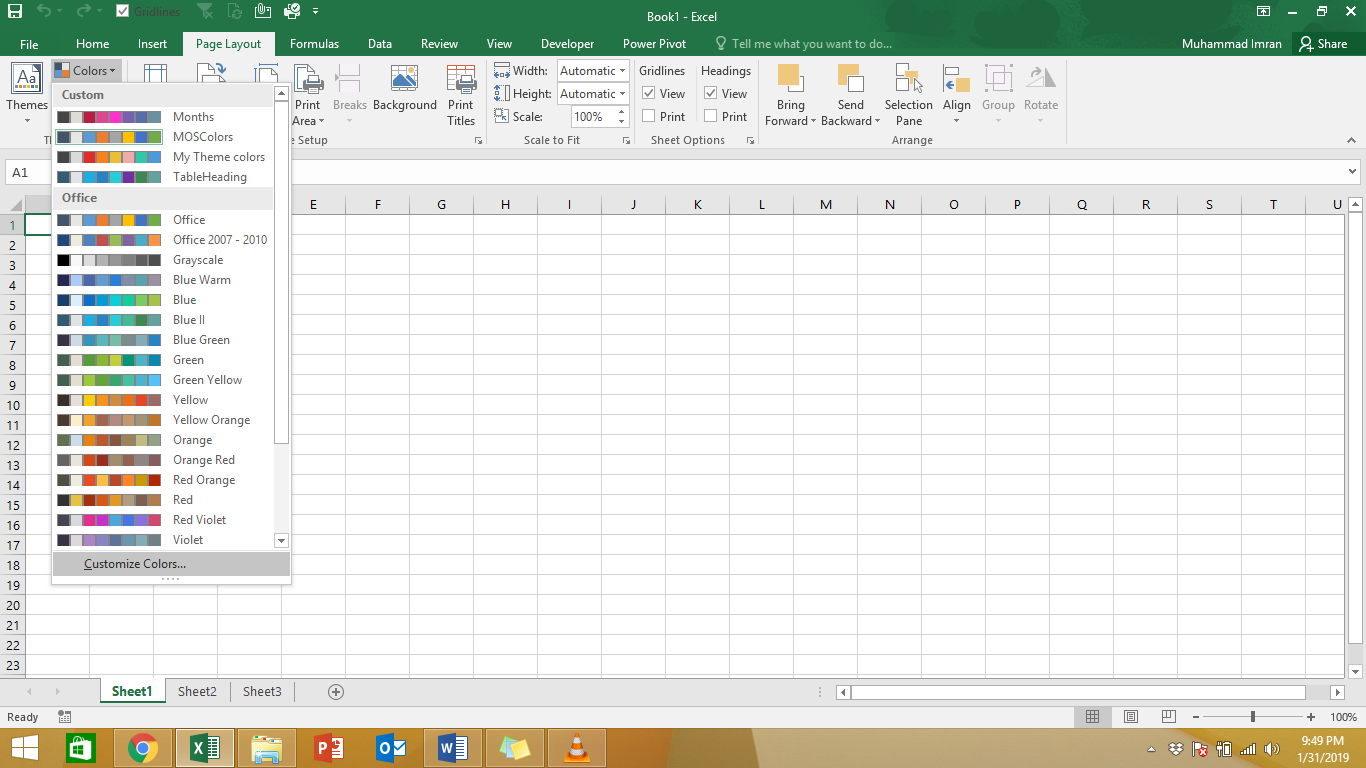
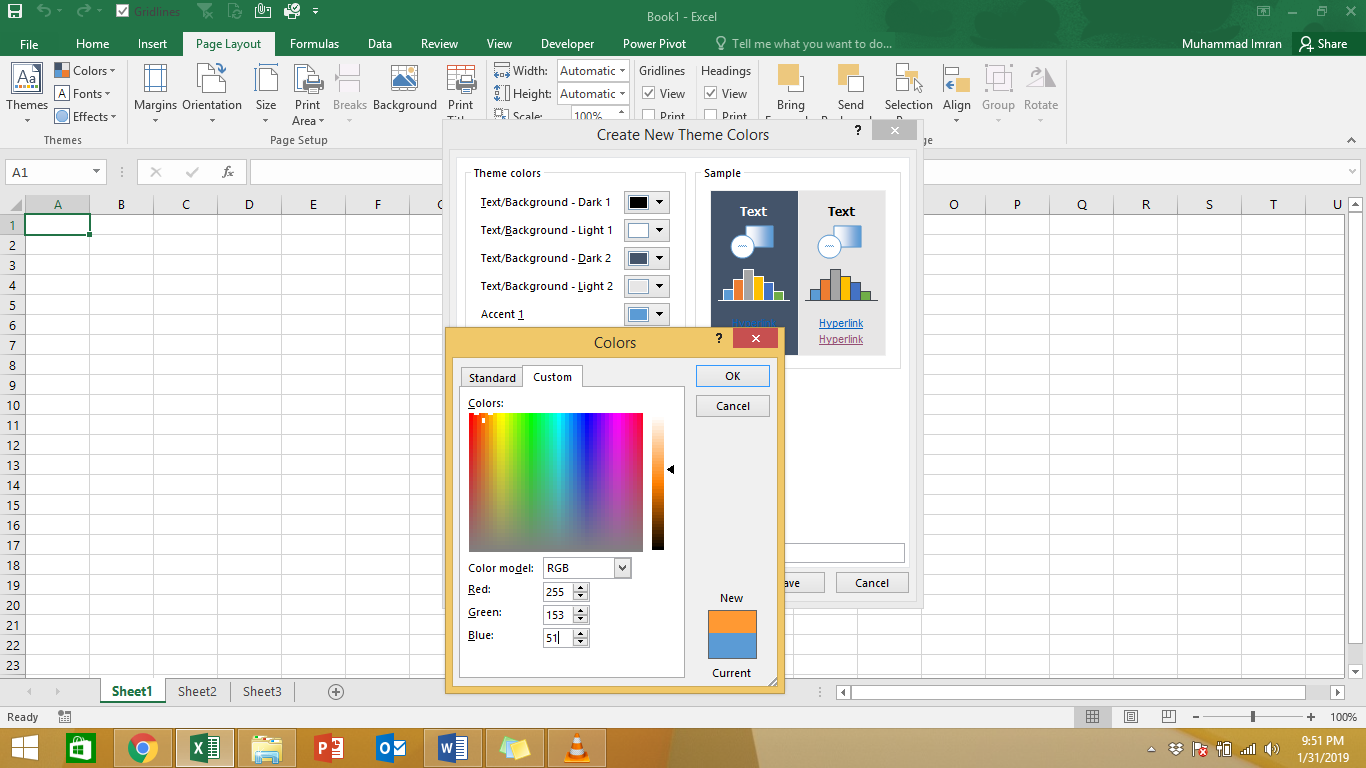
Exhibit:
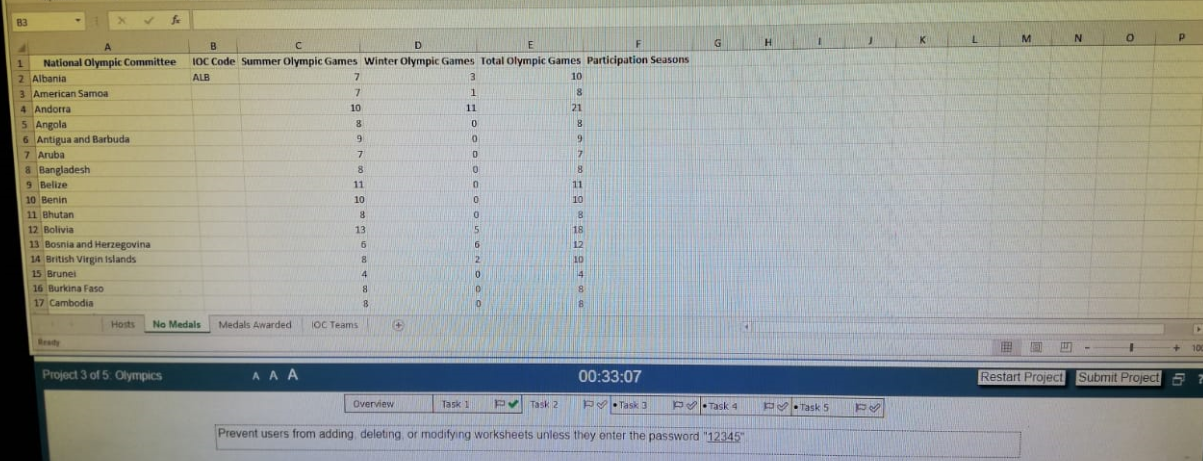
You are a news reporter. You have a been given the assignment to give a history of the Olympic Games.
Task2:
Prevent users from adding, deleting or modifying worksheets unless they enter the password “12345â€
Exhibit:
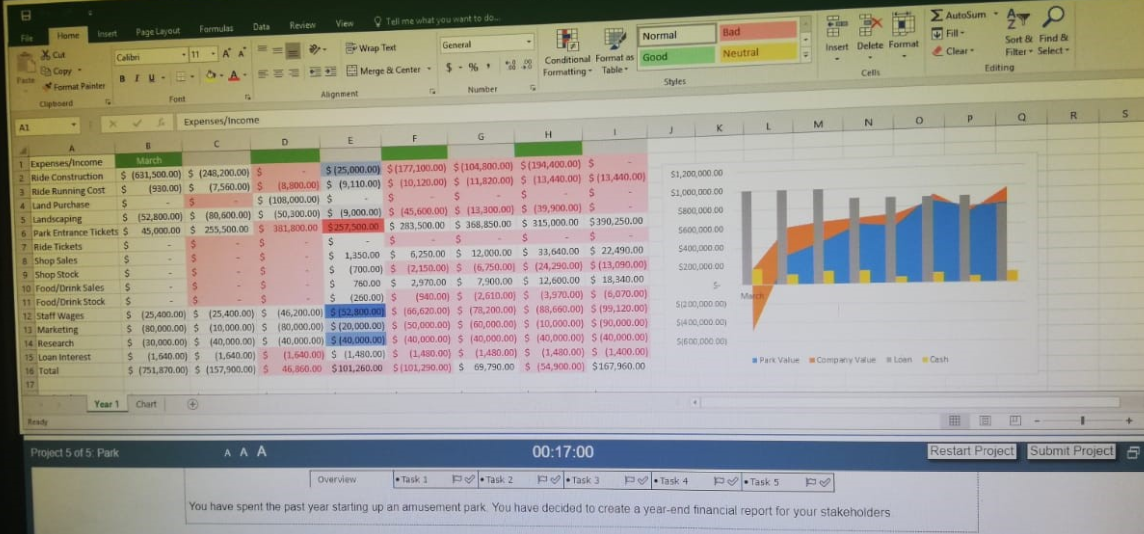
You have spent the past year starting up an amusement park. You have decided to create a year end financial report for your stakeholders.
Task 1:
Using the Fill Series option in Excel fill in the months April through October in cells C1 I1 Do not change the cell formatting.
