


Salesforce Analytics-Con-201 - Salesforce Certified CRM Analytics and Einstein Discovery Consultant
Universal Containers (UC) is using CRM Analytics to create two datasets.
* Dataset A: Contains a list of activities with an "activityID" dimension and a "userID" dimension
* Dataset B: Contains a list of users with a "userID" dimension
UC wants to delete all activities from Dataset A related to users in Dataset B.
How should the CRM Analytics consultant help UC achieve this?
Universal Containers has a dashboard for sales managers. They need the ability to visualize the number of Closed Won opportunities by month, quarter, or year, and then display the result in a single chart. A CRM Analytics consultant creates a custom query to display three values:
ClosedDate_month, ClosedDate_ quarter, and ClosedDate_year.
What should the consultant do next?
Universal Containers (UC) creates a dataset, "Book11", containing a budget per region per month for the first 6 months of the year, as shown in the graphic below. Now, UC wants to create a lens showing
the total budget for each region for each month. Every combination of region and month must be shown in the lens, even if there is no data.
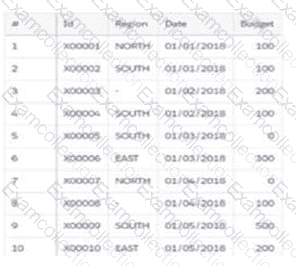
How should a CRM Analytics consultant help UC build this lens?
Universal Containers intends to use a custom Salesforce big object in its org and visualize the data using CRM Analytics. As the number of rows to be synced is quite large, the CRM Analytics consultant is looking to set up an incremental sync with additional filters added as part of the data sync to improve performance.
What should the consultant keep in mind while implementing this?
A manager at Cloud Kicks wants to separate and analyze accounts based on numeric information of its opportunity records. The data includes things like amount, quantity of products, contacts, and
quotes.
How should the CRM Analytics consultant accomplish this?
Acompany wants to create a timeline chart to visualize the evolution of its Closed Won opportunities.
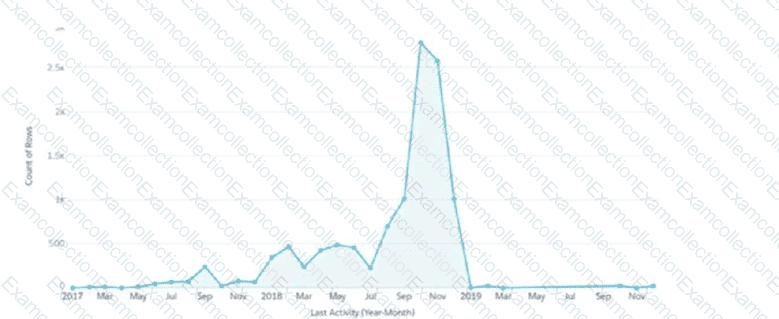
What are the required parameters to build a lens that displays output similar to the image shown?
Cloud Kicks (CK) has a dashboard that is still showing 10 former account managers. CK has since expanded, and some have moved from their former roles. CK wants the dashboard to reflect current account managers and stay up to date as new team members join.
How should the CRM Analytics developer accomplish this?
CRM Analytics users at Cloud Kicks are granted access to an app with specific dashboards. When trying to download a specific widget, they are unable to do so.
What is causing the issue?
A CRM Analytics consultant is asked to help a company report on its sales activity. The company wants to train some users to create dashboards. The company also wants one other specific team to be able to use the dashboards.
What should the consultant do to address these requirements?
A CRM Analytics administrator is working on deploying a dashboard and a dataset from a developer sandbox to a full sandbox. They have deployed the dataset via change set and manually copy-pasted the dashboard JSON into the target org. However, they notice that the conditional formatting and the widget-specific number formats have been lost in the target environment.
What is causing this issue?