


WGU Applied-Probability-and-Statistics - Applied Probability and Statistics (FZO1 C955)
Total 155 questions
Given a normal distribution with a mean of 40 and a standard deviation of 6, what is the range that contains approximately 95% of the data?
One-sample t-test compares:
t-test used when:
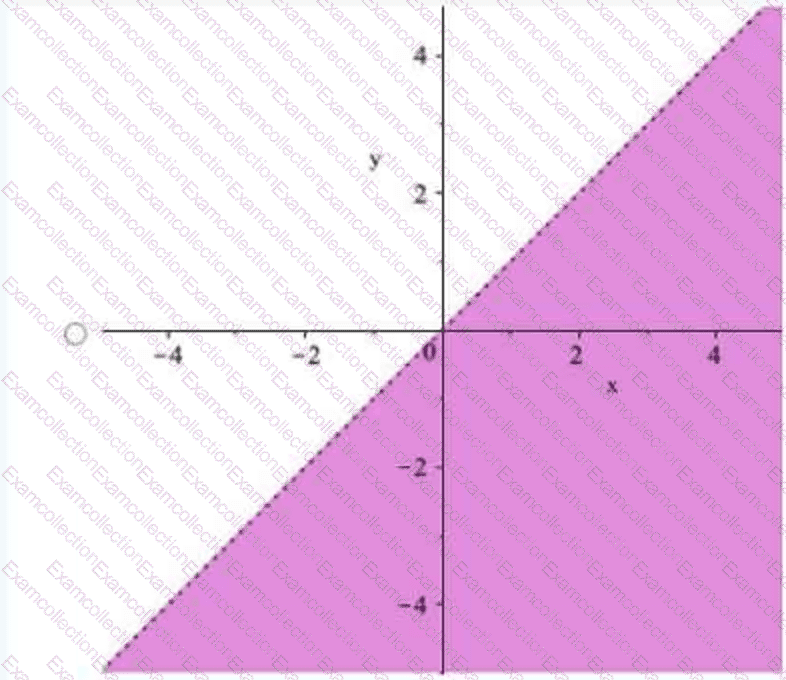
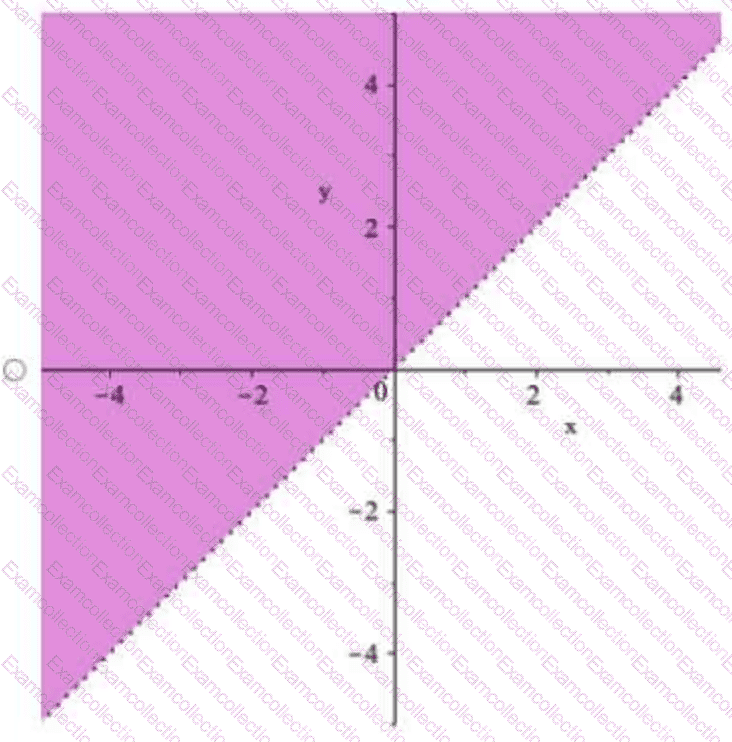
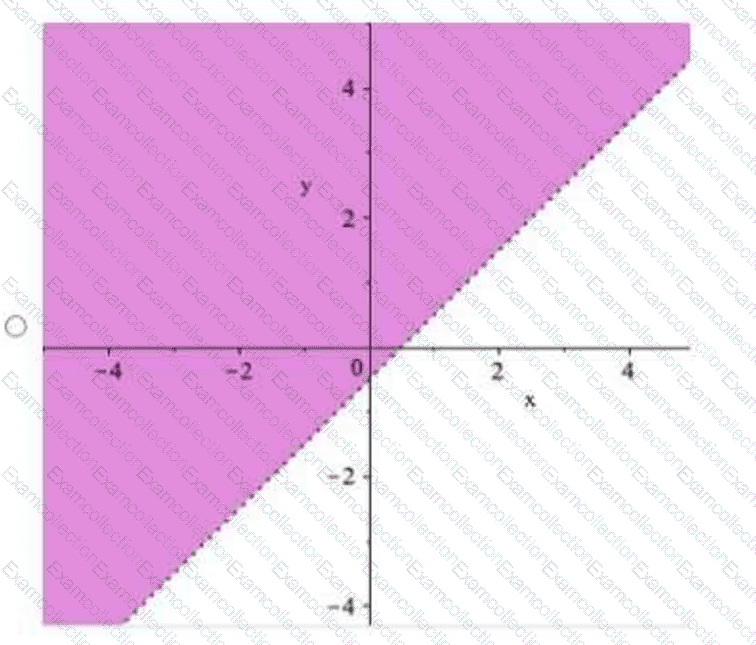
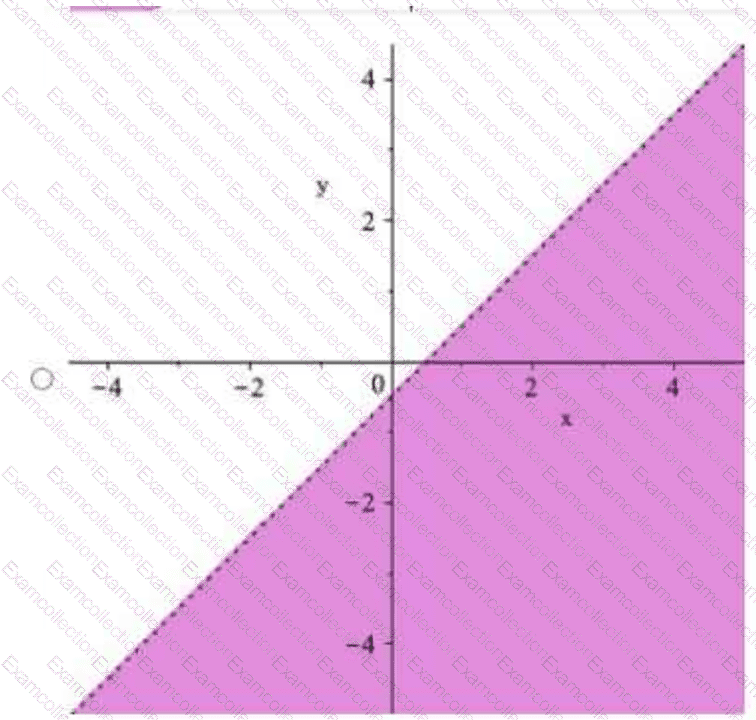
Review the following inequality:
y < x − 1/2
Which shaded portion in the graphs corresponds to this inequality?
Mean of Poisson λ = 5 = ?
A person has a .5 probability of taking a train to work, a .3 probability of carpooling, and a .2 probability of walking. The probability of being late is .2 when taking the train, .1 when carpooling, and .05 when walking.
What is the probability of taking the train and being on time, or walking and being on time?
Probability of rolling sum = 2 on 2 dice = ?
Probability of heads on 3 coin flips exactly twice?
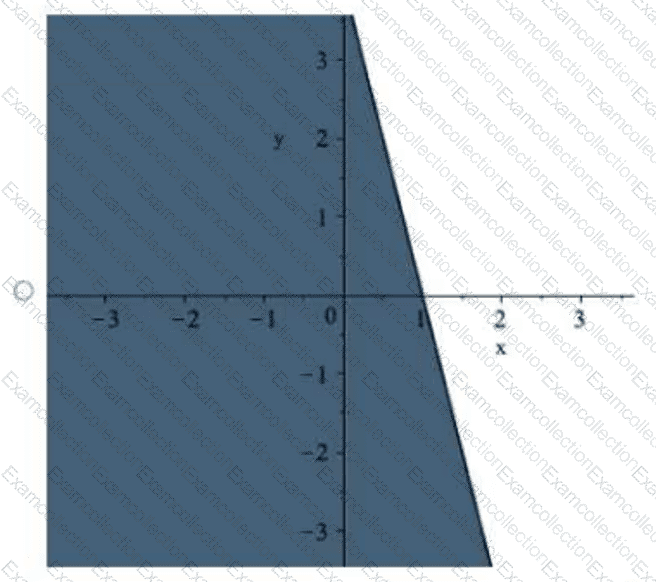
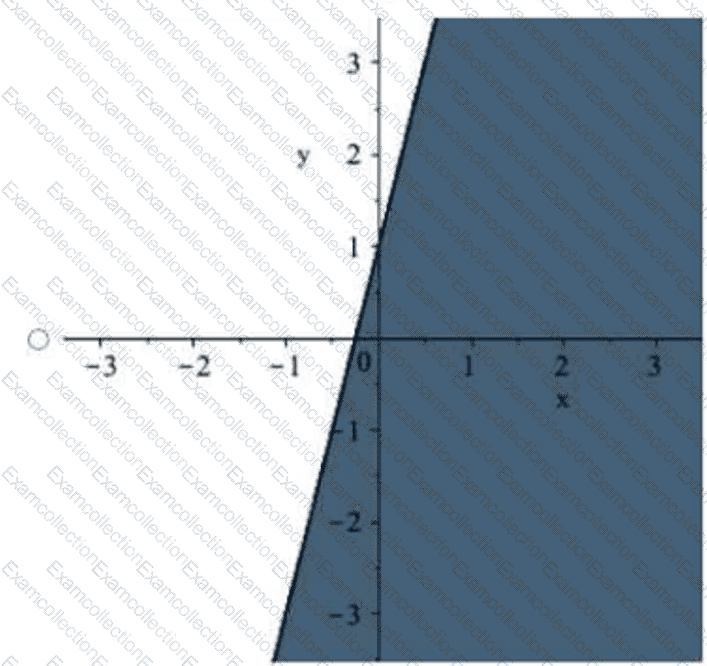
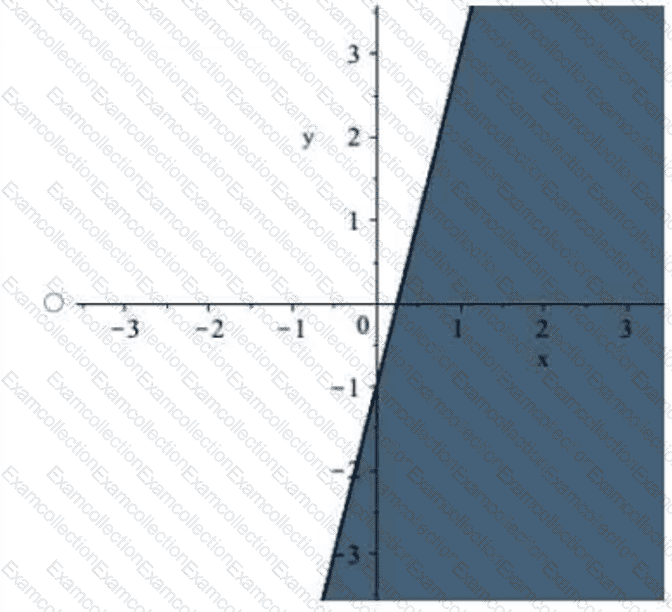
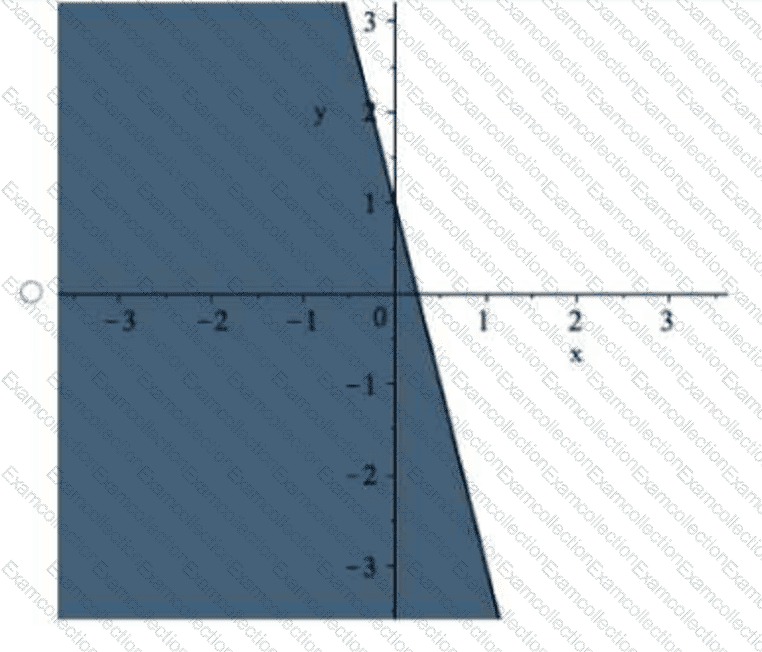
Review the following inequality:
y ≤ −4x + 1
Which shaded region is described by this inequality?
95% confidence interval for mean = (45, 55). Which statement is correct?