

GAQM CLSSBB - Certified Lean Six Sigma Black Belt (CLSSBB)
A team is investigating ways to reduce power outages. They determine that an outage can occur in only three ways: grid failure, local transformer failure or local overload. They then investigate each of these three events for possible causes, etc. They draw a diagram that “fans out†using the power outage as the handle of the fan.
These improvements are best described by which approach to problem solving?
If DPU = 0.022, the RTU is approximately:
A medicine with efficacy of .52 is given to five patients. Find the approximate probability that at least one of the patients is cured. (Hint: Use the binomial formula.)
P(A) = .42, P(B) = .58, P(A&B) = .10. Find P(A or B).
If the probability that event A occurs is 0.51, the probability that event B occurs is 0.64 and that probability that both A and B occur is 0.23 then:
A sample of size 50 from machine A has a mean of 18.2 and standard deviation 3.1. A sample of size 40 from machine B has mean 17.6 and standard deviation 2.8. Do these data indicate that the population for machine A has a larger mean? Assume the populations are normal.
A population is bimodal. One hundred samples of size 30 are randomly collected and the 100 sample means are calculated. The distribution of these sample means is:
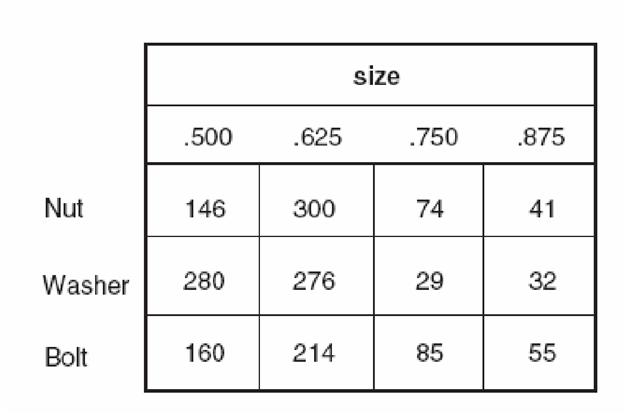
This table displays the inventory of fasteners in a storage cabinet. An item is selected at random from the fastener cabinet. Find the approximate probability it is size 3/4.
A random sample of 2500 printed brochures is found to have a total of three ink splotches. The rate of ink splotches in PPM is:
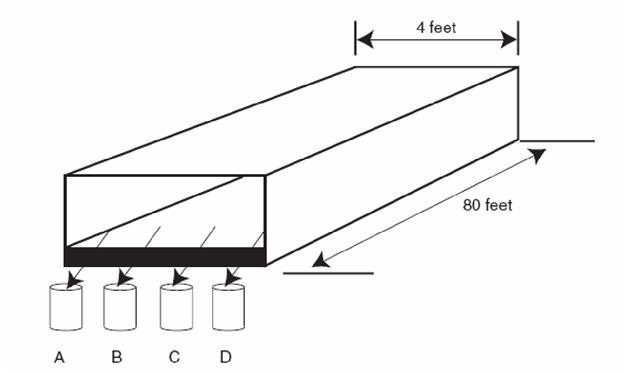
SCENARIO A Six Sigma team is measuring the moisture content of corn starch as it leaves the conveyer belt of a dryer. They collect one sample four cups of starch at times indicated in the chart at fixed locations labeled A, B, C, and D across the end of the belt. See the diagram below.
The data for a nine hour period are:
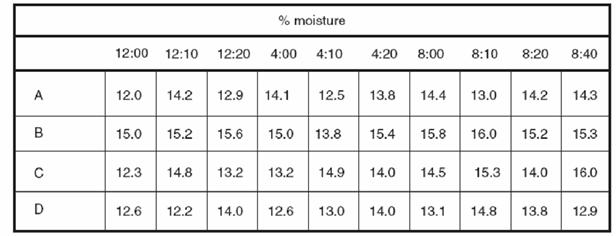

Which type of variation dominates? (Hint: Plot the points on the graph above.)
