Summer Sale Limited Time 65% Discount Offer - Ends in 0d 00h 00m 00s - Coupon code: ecus65

Salesforce CRM-Analytics-and-Einstein-Discovery-Consultant - Salesforce Certified CRM Analytics and Einstein Discovery Consultant Exam (SP25)

A CRM Analytics consultant has been asked to refactor a dashboard so that it loads quicker. After some analysis, the consultant found that most of the dashboard queries run in less than 5 seconds; however, the Opportunities Table takes more time to load when scrolled down from its initial view.

How should the consultant improve the performance of this dashboard?

A.

Create a second page on the dashboard and move the table to this new page.

B.

Create a second dashboard and move the table to this new dashboard.

C.

Create a Visualforce page and display a list view of the Opportunities on this new page.

Cloud Kicks (CK) has a dashboard in CRM Analytics with forecasting data. One widget is a compare table using the timeseries function showing the quarterly forecast. However, CK is interested in enhancing the dashboard with a weekly forecast per customer.

How should CK achieve this?

A.

An SAQL query with a timeseries statement specifying Opportunity Name as the partition and Y-M-W as the Date Cols

B.

An SAQL query with a timeseries statement specifying Account Name as the partition and Y-M-W as the Date Cols

C.

An SAQL query with @ timeseries statement specifying Account Name as the partition and Y-M-D as the Date Cols

Exhibit.

Given that the queries are using different datasets, which change should a CRM Analytics consultant make to solve this issue?

A.

Use "Connect Data Sources" and create a connection to connect the two datasets.

B.

Use “Connect Data Sources" and create a connection to connect the two widgets.

C.

Use result binding/Interaction in the filters section of the query "Type 1”.

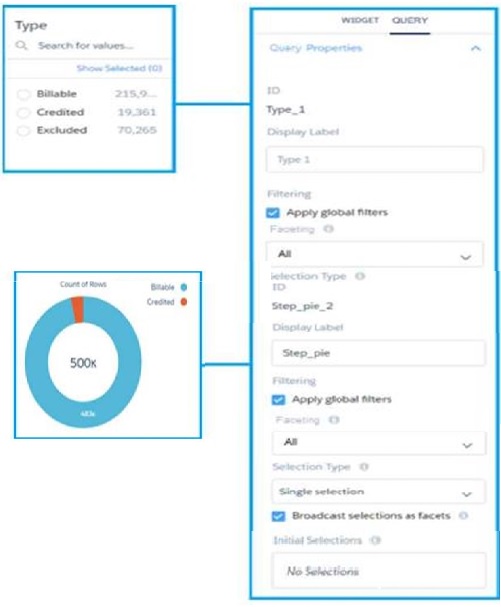
Universal Containers' CRM Analytics team is building a dashboard with two widgets, and the queries use different datasets.

1. List widget associated to the query "Type_2" and grouped by the dimension "Type" (multi-selection)

2. Donut chart widget associated to the query "Query_pie_3" and grouped by the dimension "Type"

The team wants any selection in the List widget to filter the Donut chart and vice versa. Users should be able to choose more than one Type (multi-selection).

What is the recommended way to accomplish the required filtering?

A.

Use "Connect Data Sources" to create a mapping of the two fields from the two datasets.

B.

Create a selection based Interaction and apply It to the query of "Query ple 3".

C.

Set up a result and selection based interaction for each query.

consultant is reviewing a model that is set to maximize the daily sales quantity of consumer products in stores, and they see this recommendation.

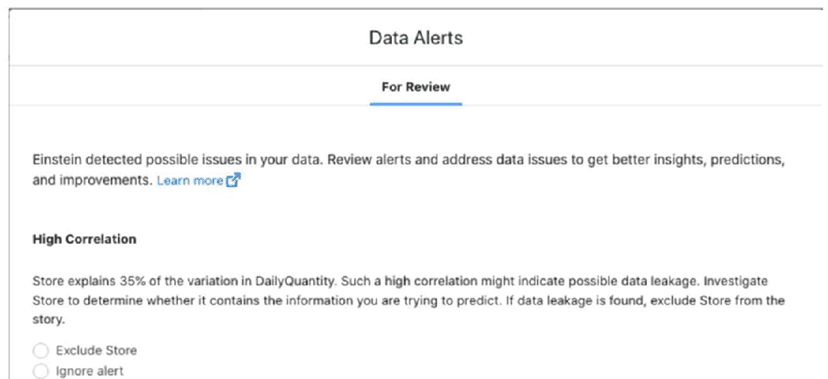
Which action should the consultant take?

A.

Verifyclient expectations that Store is a strong predictor for daily sales quantity.

B.

Remove the Store field from the model definition, because that is the recommended action.

C.

Ignore alert; the explanation of variation is only 35%, which is below 50%,

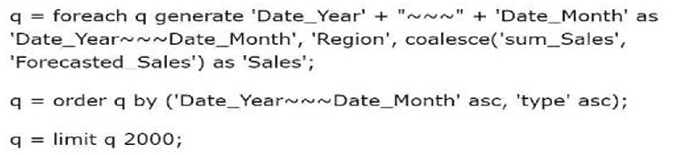
Which timeseries statement will fix the query?

A.

q= timeseries q generate 'sum_Sales' as ‘Forecasted_Sales' with (dateCols=(‘Date_Year’, ‘Date Quarter’, "Y-Q"), partition='Region', seasonality=4);

B.

q = timeserles q generate 'sum_Sales’ as 'Forecasted_Sales’ with (length=12,dateCols=("Date_Year', ‘Date_Month', "Y-M"), partition='Region');

C.

q = timeseries q generate 'sum_Sales' as 'Forecasted_Sales' with (dateCols=(‘Date_Quarter’, 'Date_Month’, "Q-M"), partition='Region’, ignoreLast=true);

Which statement best describes how to ensure CRM Analytics dashboards are easily used across both desktop and mobile devices?

A.

Create multiple layouts and reorder all the widgets so that they fit nicely within the new default width

B.

Create multiple layouts and allow CRM Analytics to automatically select and organize dashboard contents to be optimal for the device type.

C.

Create multiple layouts, ensure the layout selectors match the device, and resize/hide widgets to ensure the content is appropriate for the device screen size.

A system administrator at Cloud Kicks creates a joined report to showcase the new business deals closing in the current quarter, which was well received by the business stakeholders. A manager wants to visualize this report on CRM Analytics.

The CRM Analytics consultant determines the report can be trended on CRM Analytics, but it's not working as expected.

What is causing the issue?

A.

Trending dashboards cannot be created from joined reports.

B.

The Salesforce report was filtered on quarterly data which meant it did not have enough data to trend on CRM Analytics.

C.

The Analytics Integration user did not have permission to view the report on Salesforce.

CRM Analytics users at Cloud Kicks are granted access to an app with specific dashboards. When trying to download a specific widget, they are unable to do so.

A.

The users have access to the dashboard but not the dataset.

B.

The dashboard has been created for internal use and theusers have a view only license.

C.

The permission set for the users is missing the download data permission.

A user is able to access the dashboards, lenses, and datasets of a particular app but is unable to change the name of the specific app.

What is causing the issue?

A.

The user does not have Manager access for that app.

B.

The app name cannot be changed once created.

C.

The user does not have Editor access for that app.