

CompTIA DA0-001 - CompTIA Data+ Certification Exam
An analyst wants to include a graph in a quarterly sales report that shows the comparison between two quantitative variables. Which of the following visual diagrams can the analyst use to most effectively represent this relationship?
Which of the following differentiates a flat text file from other data types?
Mario works with a group of R programmers tasked with copying data from an accounting system into a data warehouse.
In what phase are the group's R skills most relevant?
Given the table below:
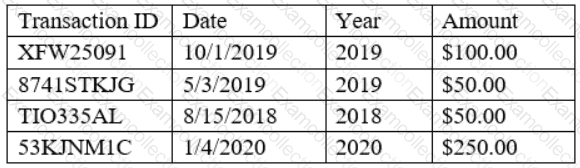
Which of the following variable types BEST describes the “Year†column?
Which of the following is an example of a data-mining ETL tool?
Which of the following data types is best for representing count data?
A database consists of one fact table that is composed of multiple dimensions. Depending on the dimension, each one can be represented by a denormalized table or multiple normalized tables. This structure is an example of a:
A data set for sales per month includes the following data:
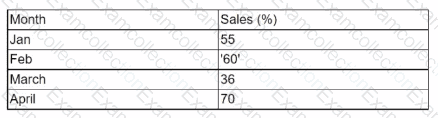
Which of the following cleaning and profiling methods should be applied to the data set?
An analyst must obtain the average daily sales for the following week:
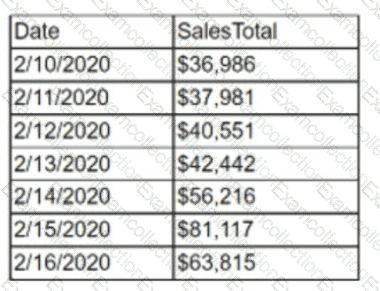
Which of the following must the analyst perform to obtain this value?
Which of the following best defines SCD?
