New Year Sale Special Limited Time 70% Discount Offer - Ends in 0d 00h 00m 00s - Coupon code: xmas50

Tableau Desktop-Specialist - Tableau Desktop Specialist Exam

Page: 5 / 10
Total 314 questions

Given a map, which of the following fields can be placed in Size,Shape,Detail,Color

A.

Profit, State, Number of Records, Sales

B.

Region, Country, Profit, State

C.

Longitude, Country, State, Sales

D.

Sales, State, Country, Profit

Which of the following 2 columns CANNOT be deleted in Tableau?

A.

Measure Names

B.

Number of Records

C.

Measure Values

D.

Calculated Fields

To display data that has both negative and positive quantitative values, Tableau Desktop will display marks by using__________________as the default.

A.

the full color range

B.

a diverging palette

C.

a sequential palette

D.

a categorical palette

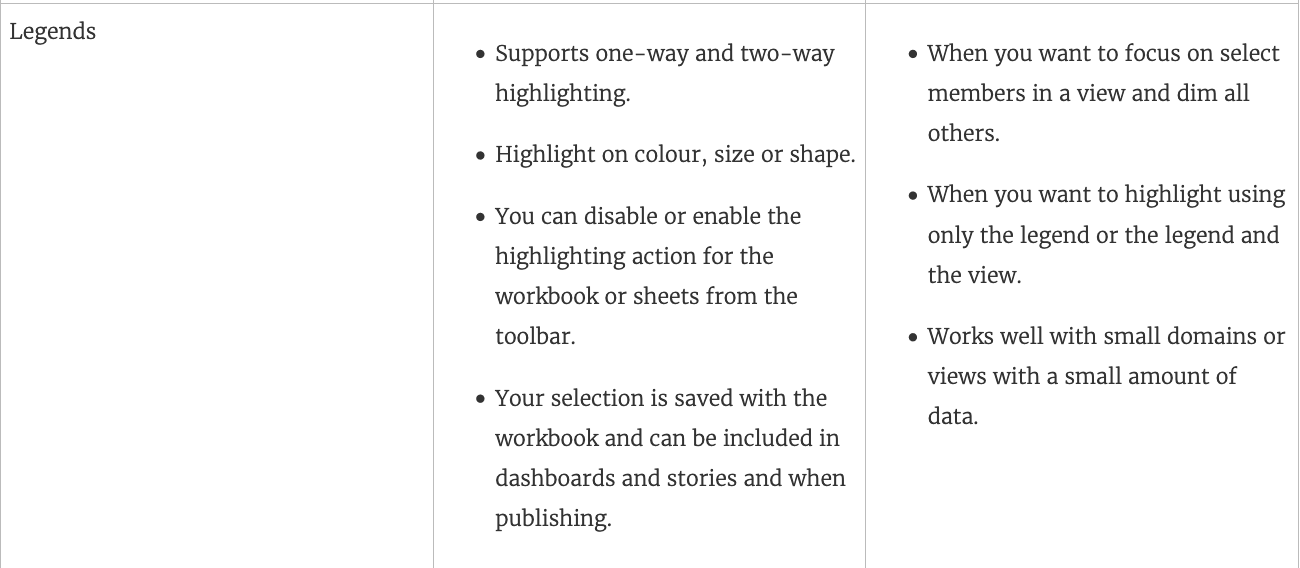
True or False: The Highlighting action can be disabled for the entire workbook.

A.

True

B.

False

You have a visualization that uses multiple types of sorting.

How can you clear all sorting of the visualization?

A.

Right-click a sorted field, and then select Clear Sort.

B.

From the Dashboard menu, select Clear.

C.

From the Header label, select the sort icon.

D.

From the Worksheet menu, select Clear, and then select Sorts.

You have a bar chart that has a dimension on the Columns shelf and a measure on the Rows shelf.

How can you make a stacked bar chart?

A.

Drag another dimension to Color on the Marks card

B.

Drag another measure to Color on the Marks card.

C.

Drag another dimension to Size on the Marks card.

D.

Drag another measure to the left of the measure on the Rows shelf.

You want to provide additional information when hovering over a field in the Data pane as shown in the following exhibit.

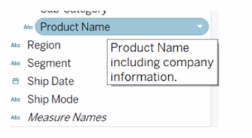
What should you configure for the field?

A.

An alias

B.

A header label

C.

A hierarchy

D.

A default comment

By definition, Tableau displays measures over time as a ____________

A.

Packed Bubble

B.

Bar

C.

Stacked Bar

D.

Line

__________ is a technique in Tableau which will identify marks with similar characteristics

A.

Clustering

B.

Grouping

C.

Sets

D.

Union

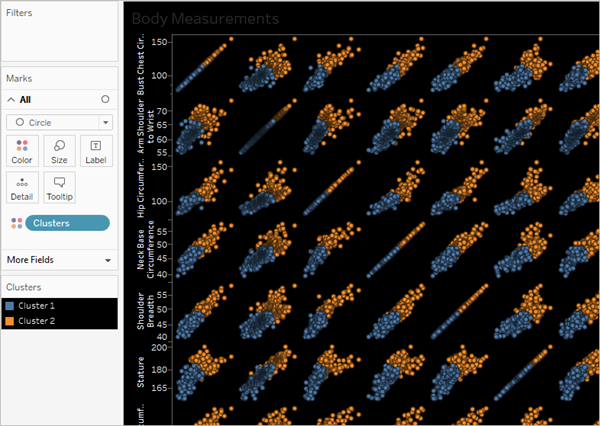
You have a scatter plot visualization.

What should you do to configure the visualization as a density map?

A.

Change the mark shape of the view.

B.

Change the mark type of the view.

C.

Create a custom color palette.

D.

Select heat maps from Show Me.