

Tableau TDS-C01 - Tableau Desktop Specialist
You create the following visualization.
What is the first step to create the visual grouping of the 10 marks shown in blue?
True or False: Tableau can create worksheet-specific filters
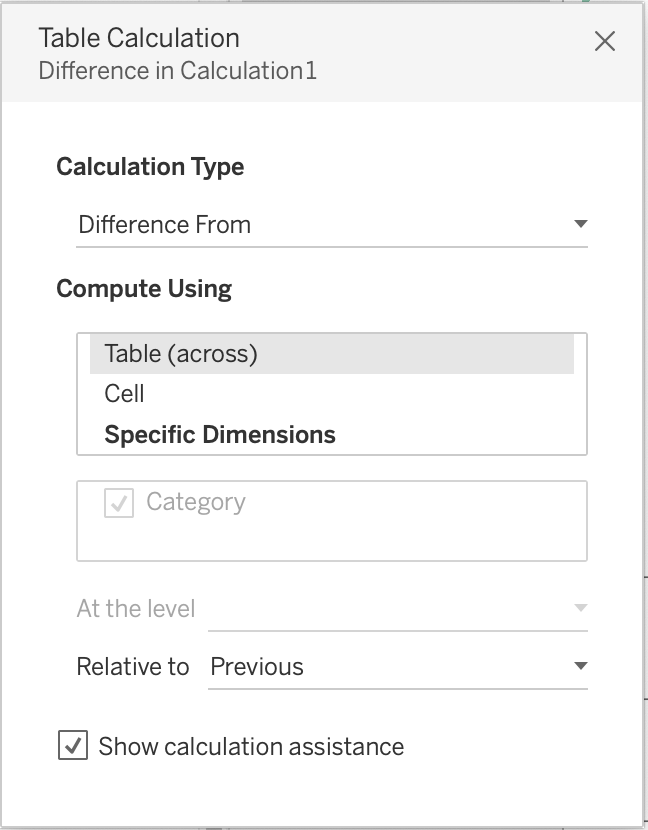
Is SUM a table calculation?
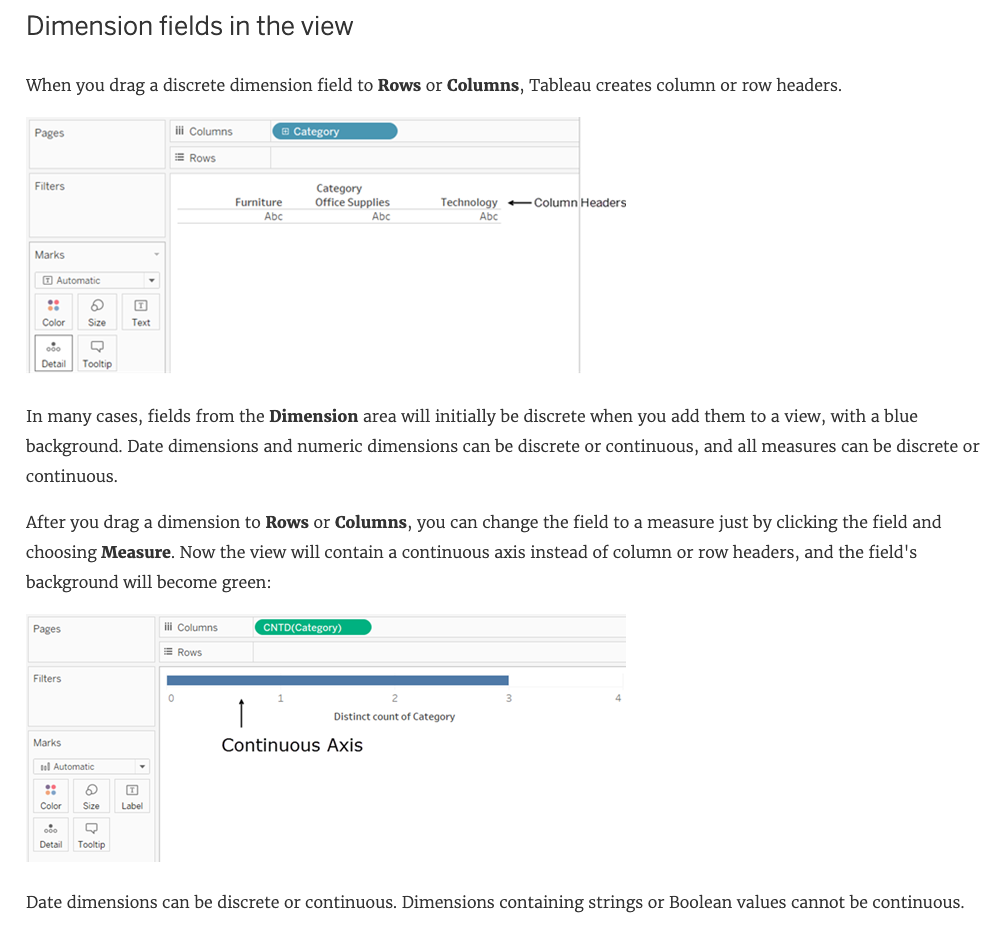
What do the colours Blue and Green represent in Tableau?
If you are working with a huge dataset, which of the following are strong reasons to use a context filter?
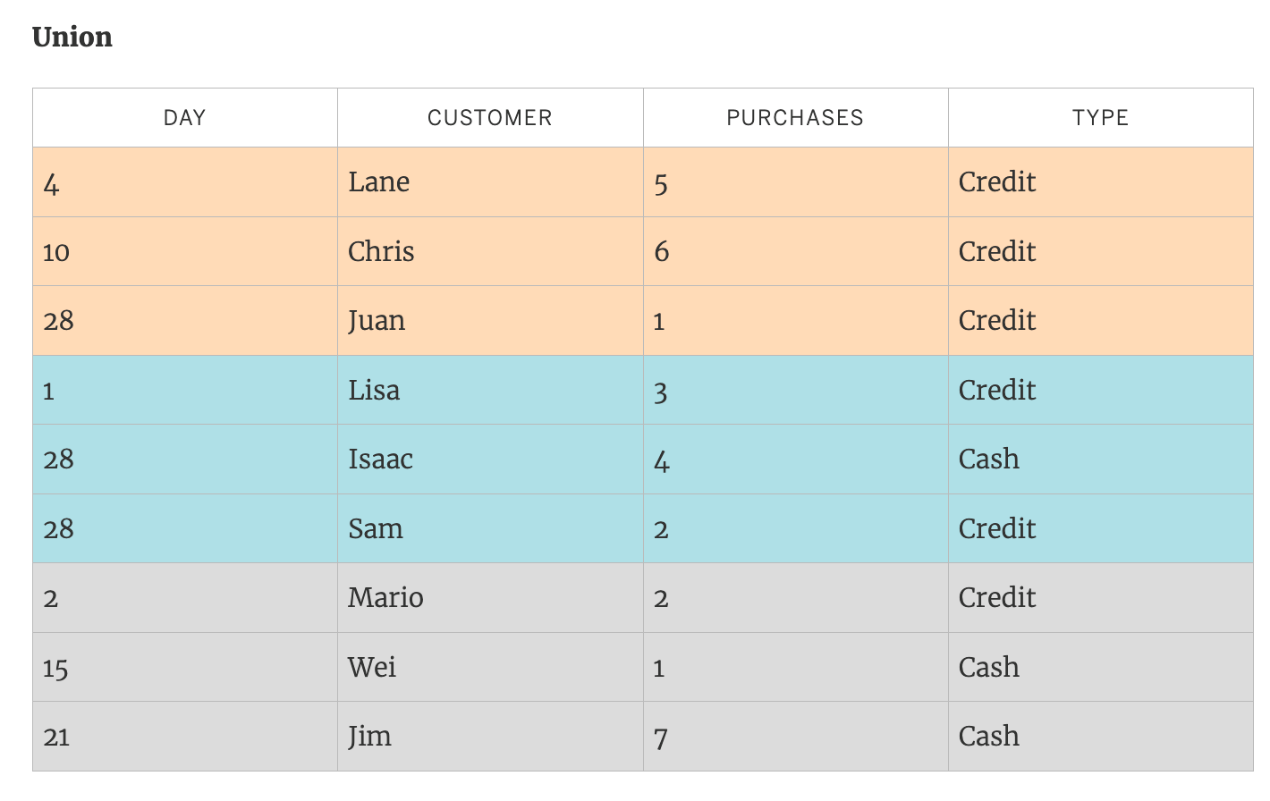
You can _______________ your data to combine two or more tables by appending values (rows) from one table to another
You want to add Custom shapes to your visualisation. Where can you add these new shapes?
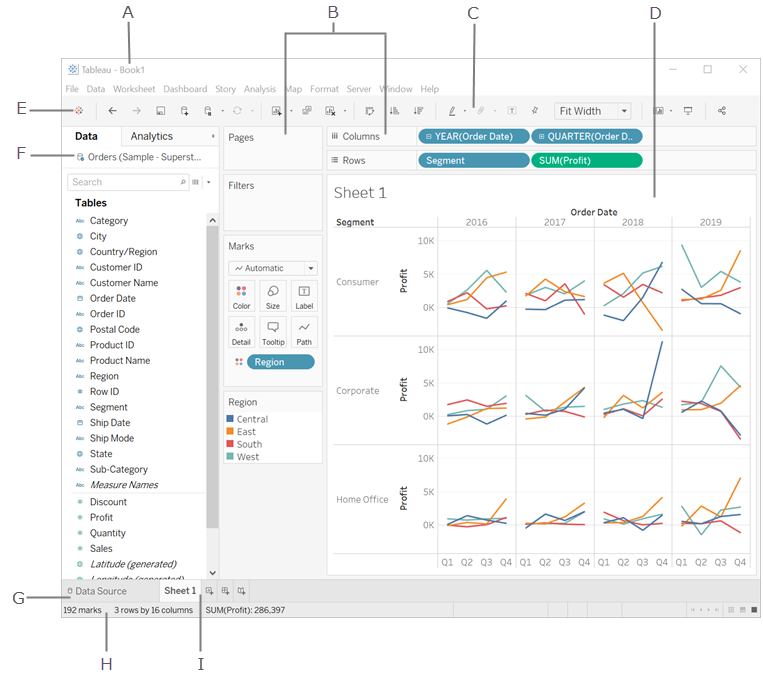
You clicked Sheet 1 from the data source page, and now you have opened the Tableau Desktop workspace as shown above. What is the main thing that you do here?
 Graphical user interface, application
Description automatically generated
Graphical user interface, application
Description automatically generatedAt a minimum, what do you need to create a simple scatter plot?
_____________ is a snapshot of the data that Tableau stores locally. Good for very large datasets of which we only need few fields.
