

CertNexus AIP-210 - CertNexus Certified Artificial Intelligence Practitioner (CAIP)
Which of the following equations best represent an LI norm?
Which of the following is a common negative side effect of not using regularization?
Which two encoders can be used to transform categorical data into numerical features? (Select two.)
We are using the k-nearest neighbors algorithm to classify the new data points. The features are on different scales.
Which method can help us to solve this problem?
When should you use semi-supervised learning? (Select two.)
Normalization is the transformation of features:
Which of the following statements are true regarding highly interpretable models? (Select two.)
Which of the following metrics is being captured when performing principal component analysis?
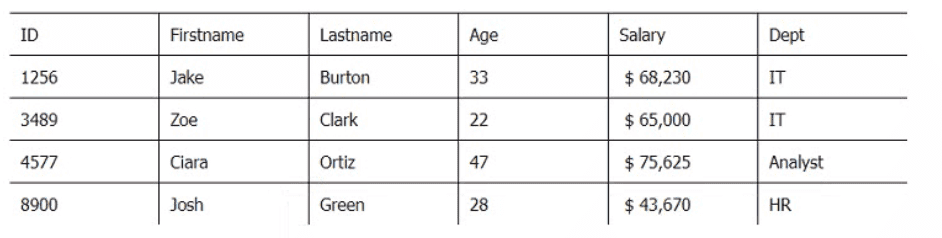
Below are three tables: Employees, Departments, and Directors.
Employee_Table
Department_Table
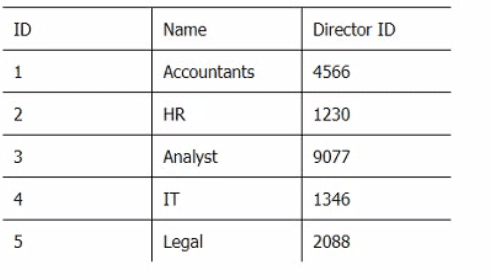
Director_Table
ID
Firstname
Lastname
Age
Salary
DeptJD
4566
Joey
Morin
62
$ 122,000
1
1230
Sam
Clarck
43
$ 95,670
2
9077
Lola
Russell
54
$ 165,700
3
1346
Lily
Cotton
46
$ 156,000
4
2088
Beckett
Good
52
$ 165,000
5
Which SQL query provides the Directors' Firstname, Lastname, the name of their departments, and the average employee's salary?
Your dependent variable data is a proportion. The observed range of your data is 0.01 to 0.99. The instrument used to generate the dependent variable data is known to generate low quality data for values close to 0 and close to 1. A colleague suggests performing a logit-transformation on the data prior to performing a linear regression. Which of the following is a concern with this approach?
Definition of logit-transformation
If p is the proportion: logit(p)=log(p/(l-p))
