

Salesforce Analytics-Con-301 - Salesforce Certified Tableau Consultant
A client notices that several groups are sharing content across divisions and are not complying with their data governance strategy. During a Tableau Server
audit, a consultant notices that the asset permissions for the client's top-level projects are set to "Locked," but that "Apply to Nested Projects" is not checked.
The consultant recommends checking "Apply to Nested Projects" to enforce compliance.
Which impact will the consultant's recommendation have on access to the existing nested projects?
A consultant creates a histogram that presents the distribution of profits across a client's customers. The labels on the bars show percent shares. The consultant
used a quick table calculation to create the labels.
Now, the client wants to limit the view to the bins that have at least a 15% share. The consultant creates a profit filter but it changes the percent labels.
Which approach should the consultant use to produce the desired result?
A client has a large data set that contains more than 10 million rows.
A consultant wants to calculate a profitability threshold as efficiently as possible. The calculation must classify the profits by using the following specifications:
. Classify profit margins above 50% as Highly Profitable.
. Classify profit margins between 0% and 50% as Profitable.
. Classify profit margins below 0% as Unprofitable.
Which calculation meets these requirements?
A client builds a dashboard that presents current and long-term stock measures. Currently, the data is at a daily level. The data presents as a bar chart that
presents monthly results over current and previous years. Some measures must present as monthly averages.
What should the consultant recommend to limit the data source for optimal performance?
An online sales company has a table data source that contains Order Date. Products ship on the first day of each month for all orders from the previous month.
The consultant needs to know the average number of days that a customer must wait before a product is shipped.
Which calculation should the consultant use?
A client collects information about a web browser customers use to access their website. They then visualize the breakdown of web traffic by browser version.
The data is stored in the format shown below in the related table, with a NULL BrowserID stored in the Site Visitor Table if an unknown browser version
accesses their website.
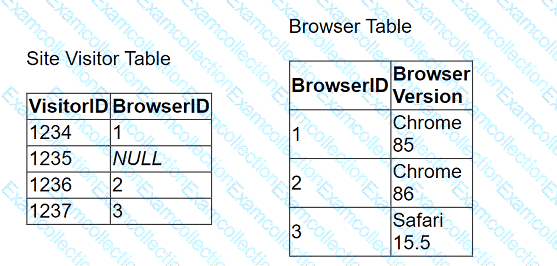
The client uses "Some Records Match" for the Referential Integrity setting because a match is not guaranteed. The client wants to improve the performance of
the dashboard while also getting an accurate count of site visitors.
Which modifications to the data tables and join should the consultant recommend?
A client wants to view stores serviced by delivery drivers on a map. The have the information provided in the table below:

What does the client need to do to plot exact street addresses on the map?
A shipping clerk wants to use a Sankey diagram to analyze the flow of goods between different categories, shipping modes, and locations to spot bottlenecks and optimize the most critical paths. The company uses Tableau Cloud.
How should the shipping clerk create a chart that depicts the above information?
A client is working in Tableau Prep and has a field named Orderld that is compiled by country, year, and an order number as shown in the following table.
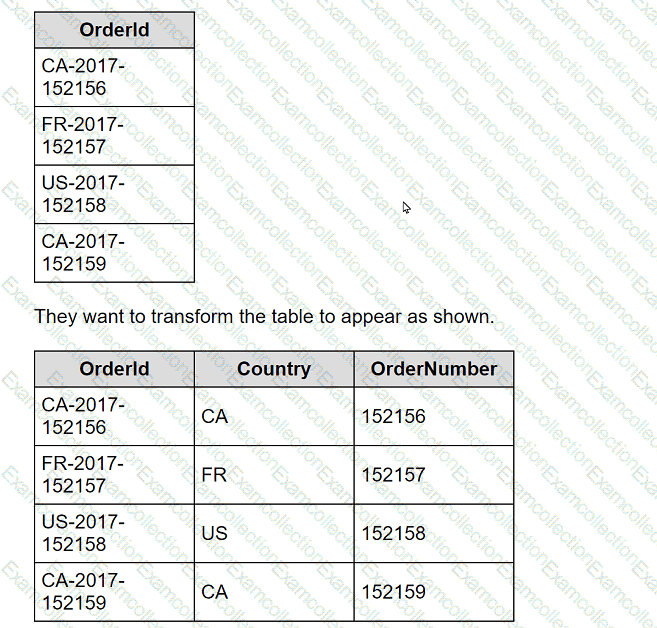
What should the consultant use to transform the table in the most efficient manner?
A consultant used Tableau Data Catalog to determine which workbooks will be affected by a field change.
Catalog shows:
Published Data Source → 7 connected workbooks
Field search (Lineage tab) → 6 impacted workbooks
The client asks: Why 7 connected, but only 6 impacted?
