

Salesforce Analytics-DA-201 - Salesforce Certified Tableau Data Analyst
You have the following dataset.
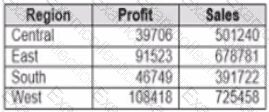
You need to create the following worksheet.
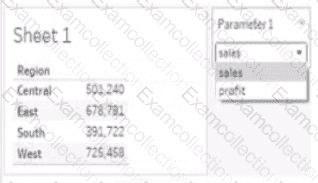
The table must show either profit or sales based on the selection from the Parameter 1 menu.
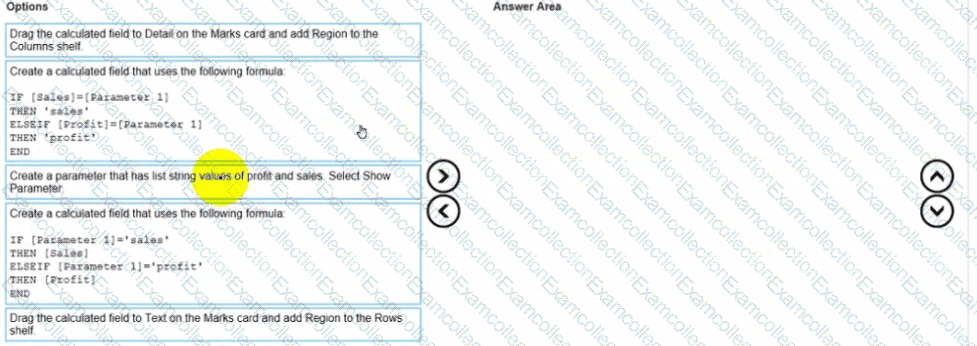
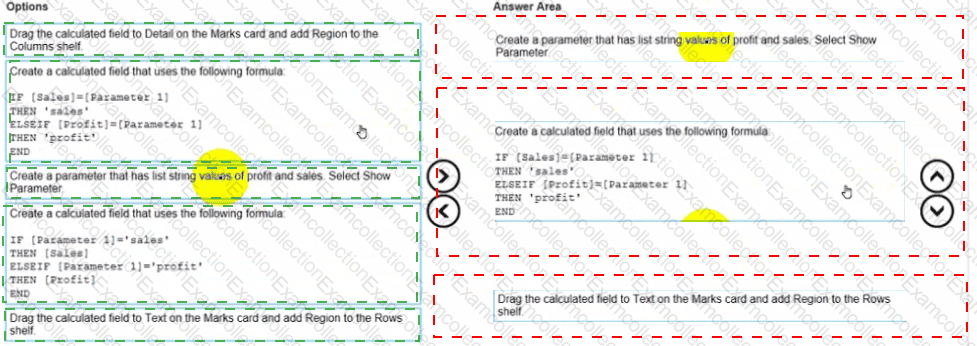
Which three actions should you perform in orders
(Place the three correct options in order Use the arrows to move Options lo Answer Area Use Answer Area arrows to reorder the options)
You want to connect a Tableau workbook to a dataset in a Microsoft Excel spreadsheet.
What should you do from Tableau Desktop?
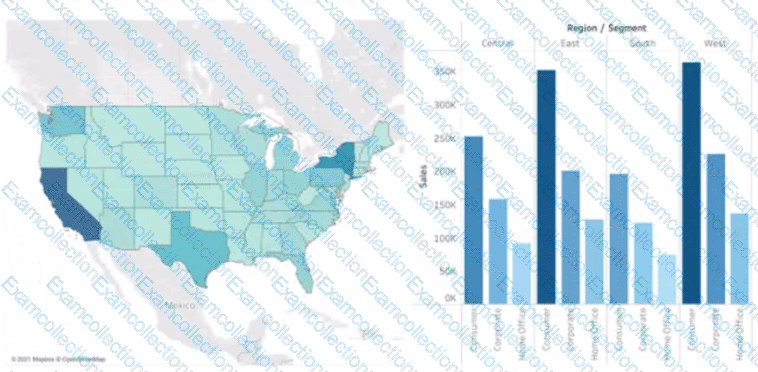
You have the following dashboard.
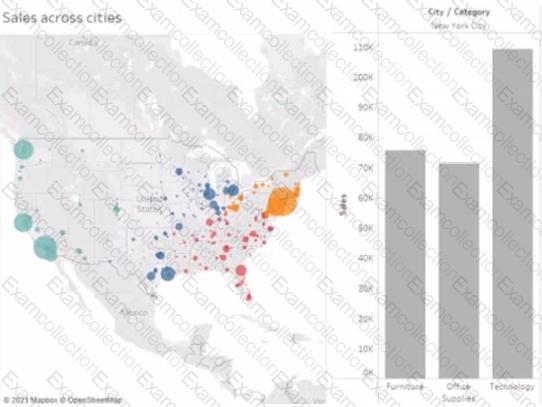
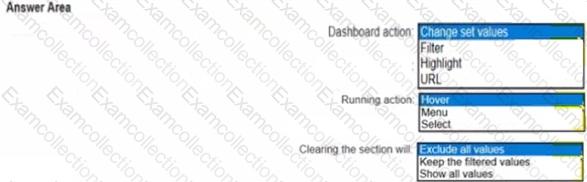
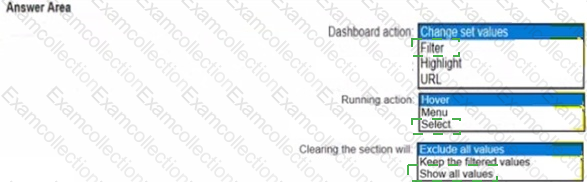
When a user selects a only on the map the data on the bar chart must show only the data for the selected city. The data in the bar chart must change only when the user selects a different city How should you configure the dashboard action? (Use the dropdowns in the Answers Area to select the correct options.)
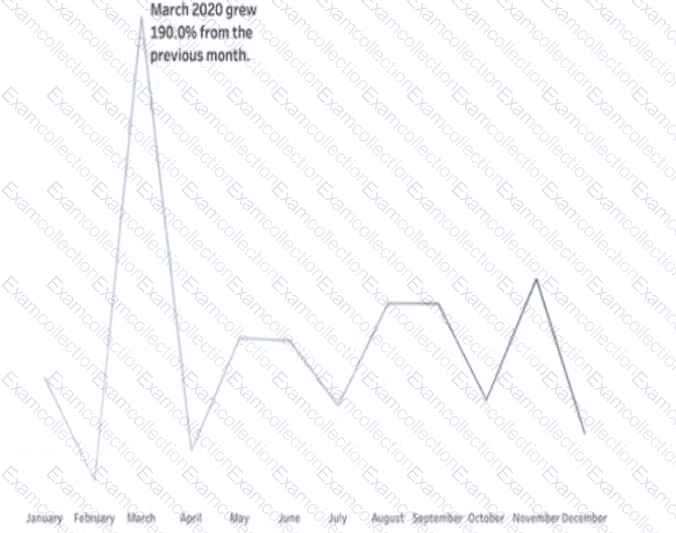
You have a line chart on a worksheet.
You want to add a comment to March 2020 as shown in the following visualization.
What should you do?
You have the following line chart that shows the average sales by month.
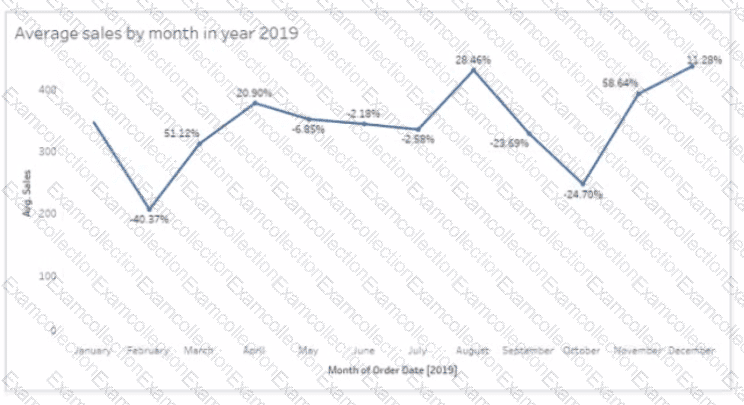
Which month had the biggest increase in swage sales compared to me previous month in 2019?
You are the owner of an alert.
You receive an email notification that the alert was suspended
From where can you resume the suspended alert?
You have the following box plot that shows the distribution of average profits made in every state by region.
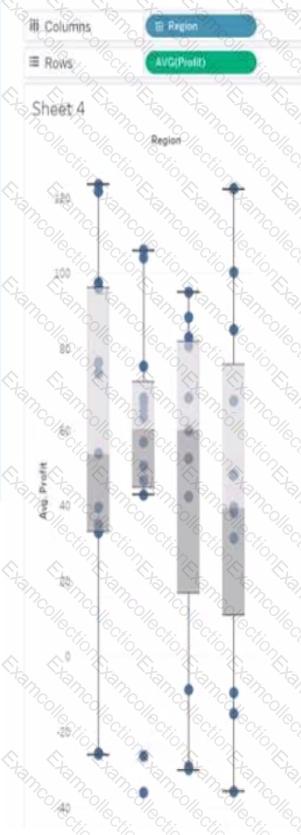
Which region has the smallest distribution of profits?
You have a database that includes field named sales, City and Region.
You have the following chart that shows the number of sales made in different cities.
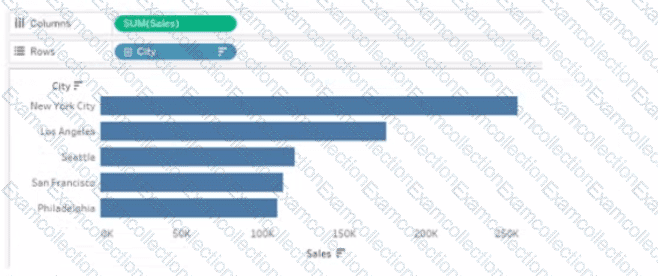
You want to dynamically show the corresponding region when users hover their mouse over any of the bars.
What should you do?
You have the following dataset.
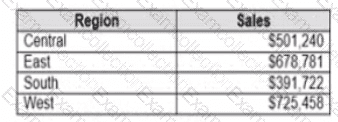
Which Level of Detail (LOD) expression should you use to calculate tie grand total of all the regions?
You have the following dashboard that contains two visualizations.
You want to show only one visualization at time. Users must be able to switch between visualizations.
What should you me?
