

Salesforce Analytics-DA-201 - Salesforce Certified Tableau Data Analyst
Which function should a Data Analyst use to average sales at a less-granular level of detail than is in the view?
You want to create the following dashboard.
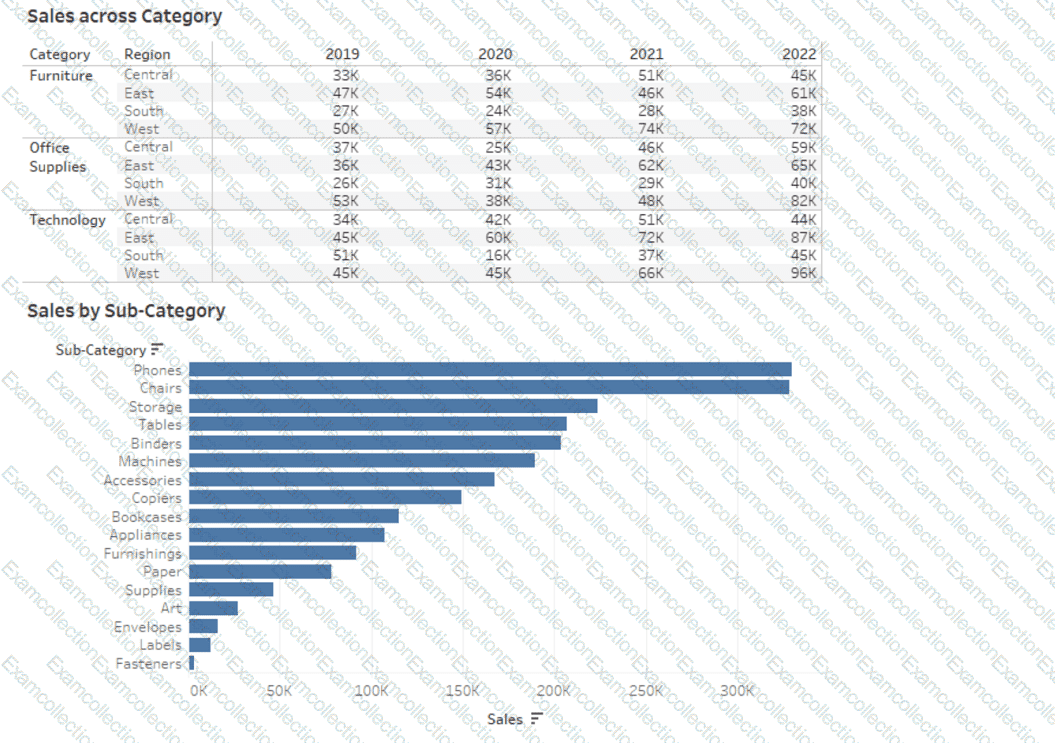
The dashboard will contain two sheets that will connect to the same data source. The top sheet will be configured to filter the bottom sheet.
When you click a category on the top sheet, the sheets must resize as shown in the following exhibit.
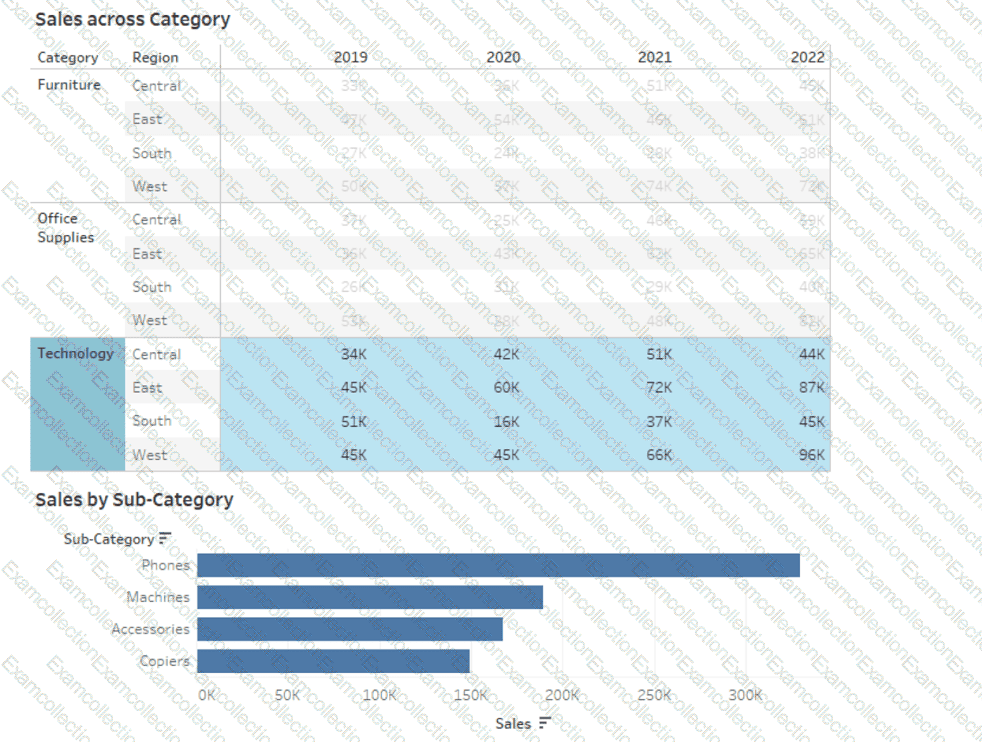
How should you lay out the objects on the dashboard?
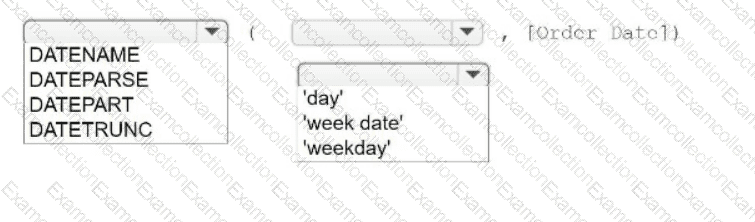
You have a table that contains four columns named Order Date, Country, Sales, and Profit.
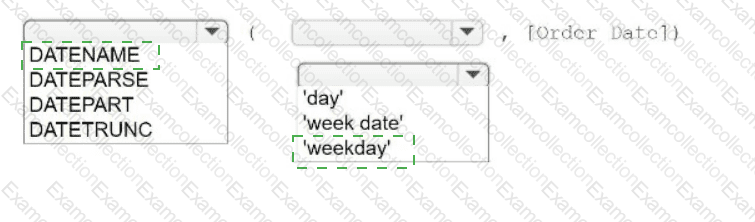
You need to add a column that shows the day of the week for each row. For example, orders placed on August 31, 2022, will show a day of
Wednesday.
How should you complete the formula? (Use the dropdowns in the Answer Area to select the correct options to complete the formula.)
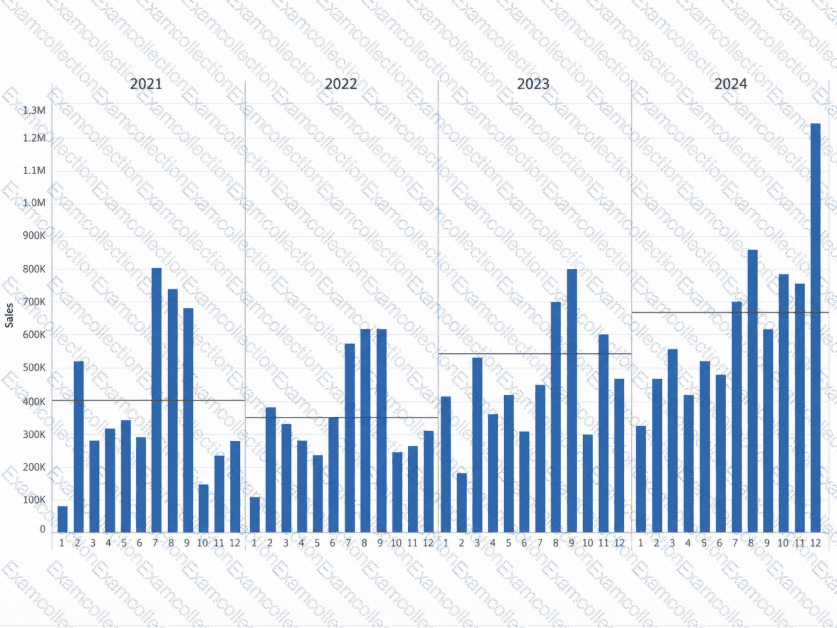
How should a Data Analyst configure the reference lines so that they appear as shown in the following chart?
A Data Analyst has the following bar chart.
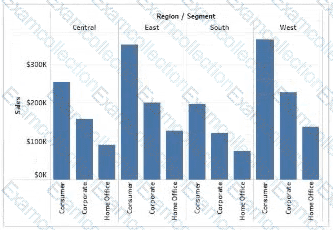
The analyst wants the chart to appear as shown in the following exhibit.
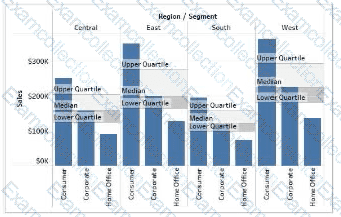
What should the analyst add?
A Data Analyst needs to add a custom color palette to Tableau Desktop for use across multiple workbooks. The palette must reflect the company ' s branding.
What should the analyst do?
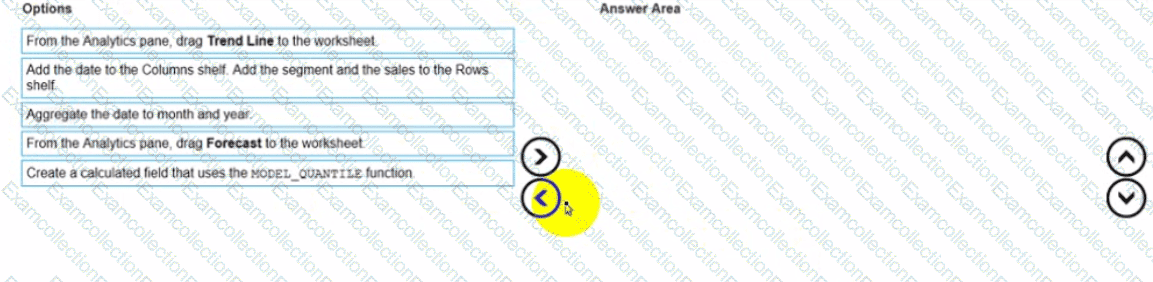
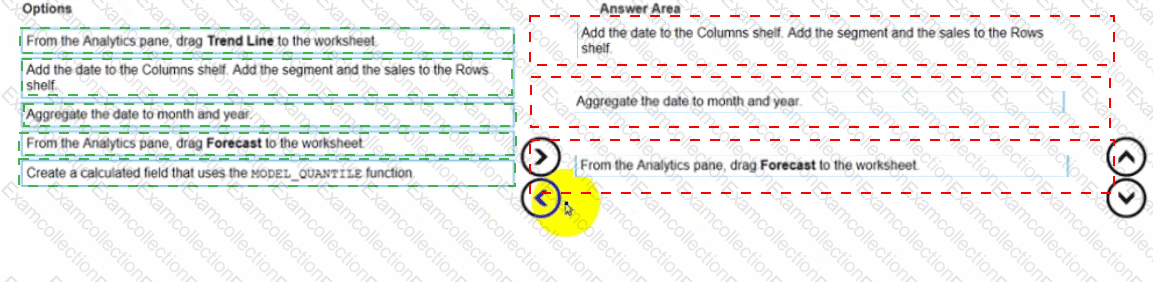
You have a dataset that contains daily sales by business segment from 2017 to the present
You want to use monthly historical trends to predict sales by segment in the future
Which three actions should you perform m order?
(Place the three correct options in order Use the arrows to move Options lo Answer Area I In Answer Area arrows to re order the options.)
A colleague provides a Data Analyst with access to a folder that has the following files:
Sales.csv
Book1.json
Sales.tds
Export.mdb
Which file can contain information for connecting to an external data source, such as an SQL Server database?
You have the following data source in tableau Server.
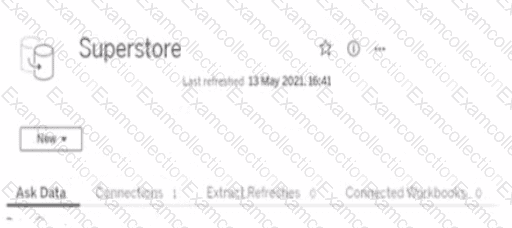
You need to ensure that the data is updated every hour.
What should you select?
You have the following line chart that shows the average sales by month.
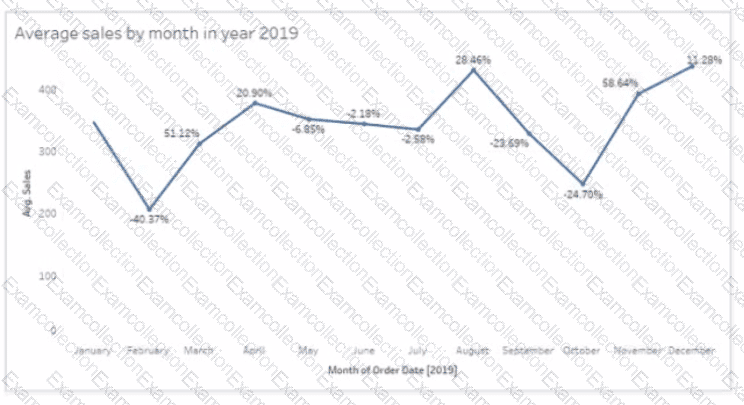
Which month had the biggest increase in swage sales compared to me previous month in 2019?