

Salesforce Analytics-DA-201 - Salesforce Certified Tableau Data Analyst
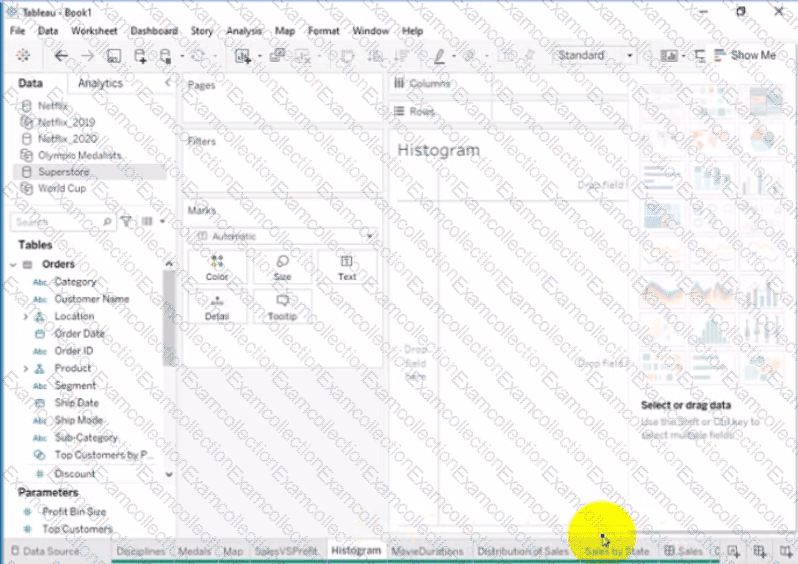
Open the link to Book1 found on the desktop. Open the Histogram worksheet and use the Superstone data source.
Create a histogram on the Quantity field by using bin size of 3.
A Data Analyst has the following chart that shows the sum of sales made in different cities.
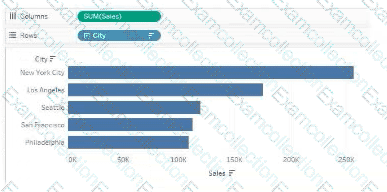
The analyst wants to show the average sale amount for a city when users hover their mouse over any of the bars.
What should the analyst do?
A Data Analyst has the following dashboard.
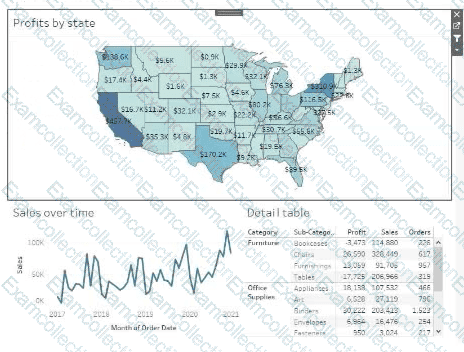
Currently, the map is used as a filter that affects the data on the other sheets of the dashboard.
The analyst needs to configure the dashboard to ensure that selecting a data point on the map only filters the Detail table.
What should the analyst do?
You publish a dashboard that uses an extract. The extract refreshes every Monday at 10:00.
You need to ensure that the extract also refreshes on the last day of the month at 18:00.
What should you do?
in which three formats can you export a worksheet from the Worksheet menu? Choose three
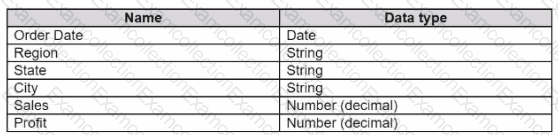
You have a data source that contains the following columns.
You have the following view that shows the percentage of total sales by category:
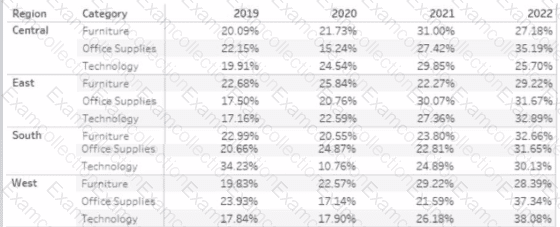
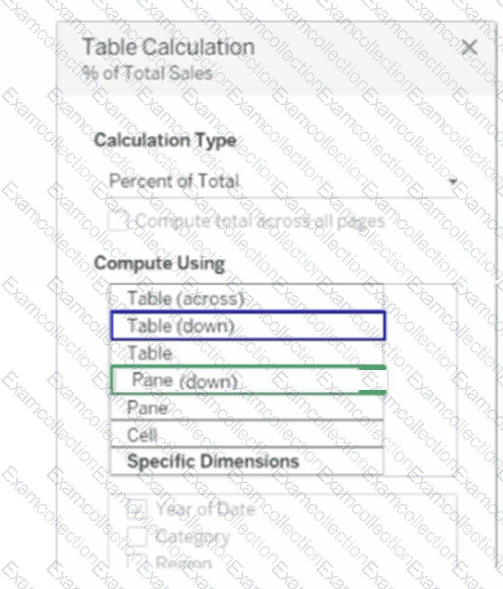
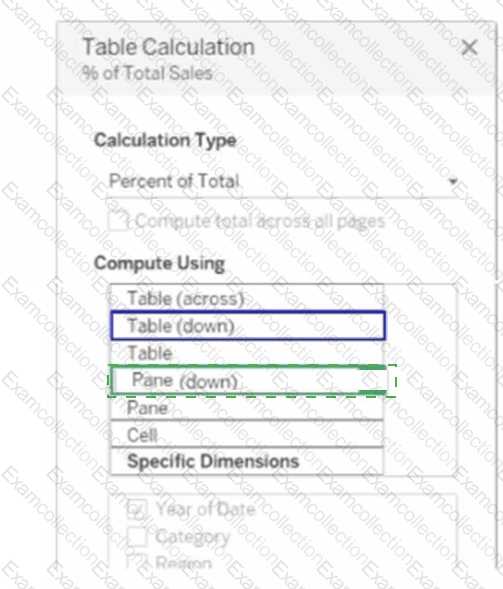
You want to change the calculation to show the percentage of total sales within the categories of every region annually. Which Compute Using option should you use? (Click the appropriate Option in the Answer Area.)
You have the following chart that shows the cumulative of sales from various dates.
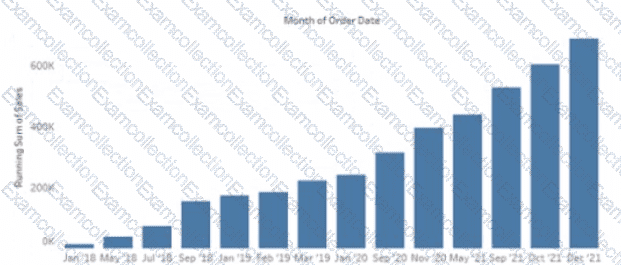
You want the months to appear as shown in the following chart.
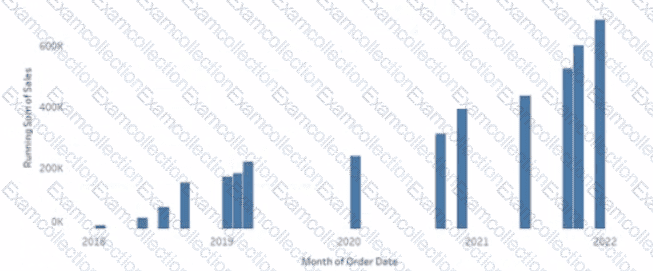
What should you do?
A Data Analyst creates a parameter named Choose Region that contains values from a field named Region.
The analyst wants users to be able to use the Choose Region parameter to interact with a chart by toggling between different regions.
What should the analyst do next?
You have a table that contains the following data.
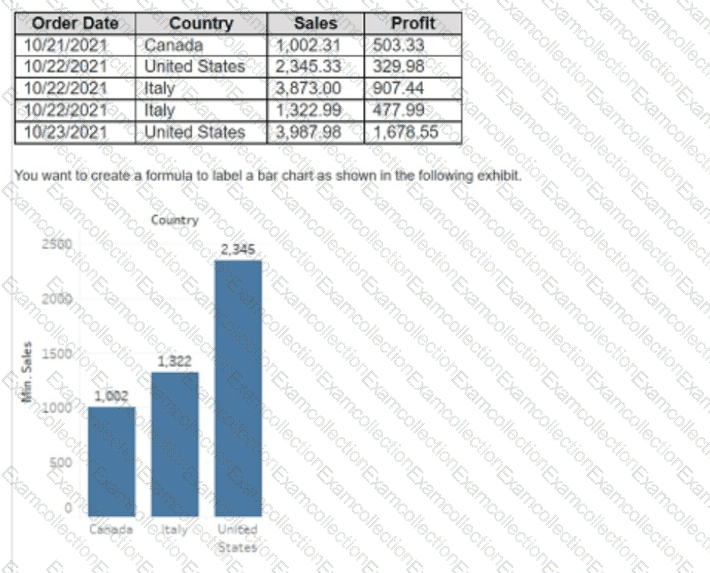
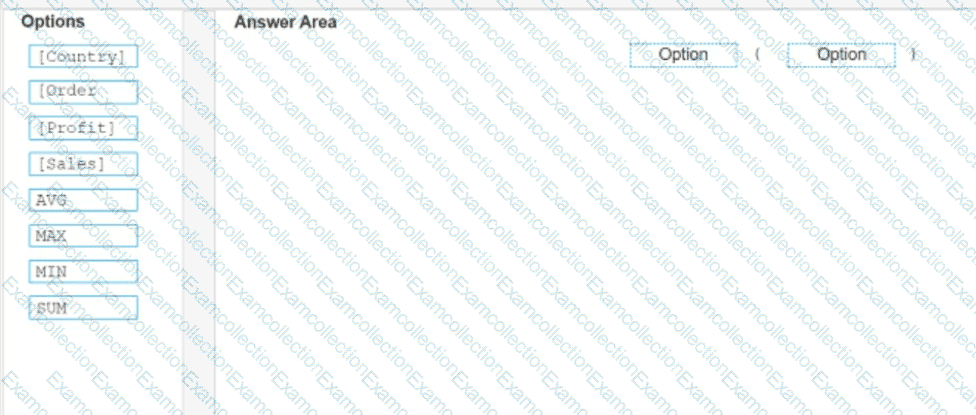
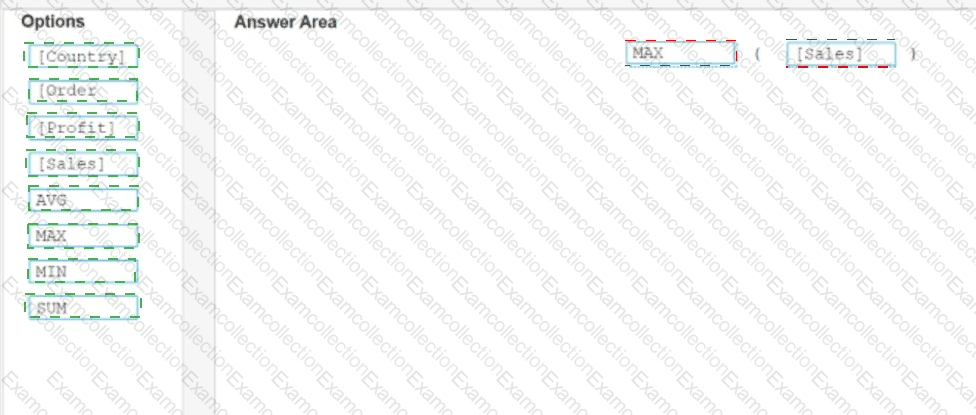
How should you complete the formula? (Drag the appropriate Options to the Answer Area and drop into the correct locations.)
In a dataset, you have a string field named Name that contains unnecessary semicolons.
Which function should you use to remove the semicolons from the Name field?
