Salesforce Analytics-DA-201 - Salesforce Certified Tableau Data Analyst
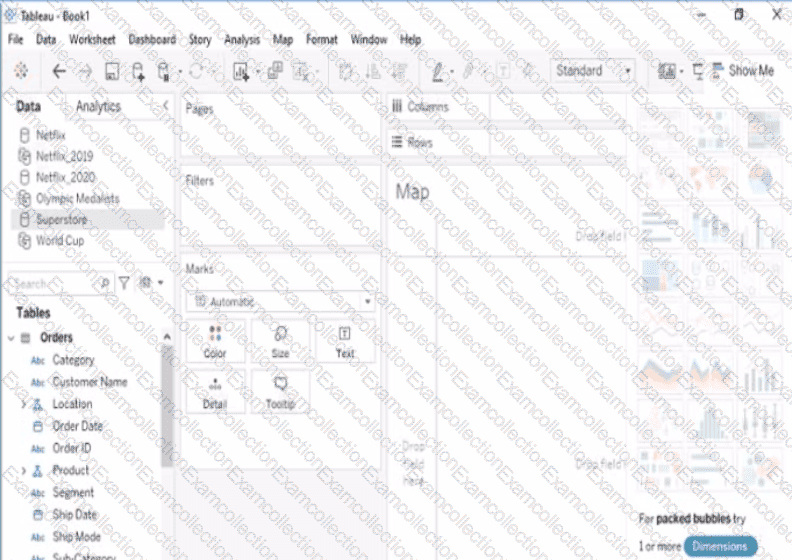
Open the Link to Book1 found on the desktop. Open Map worksheet and use Superstore data source.
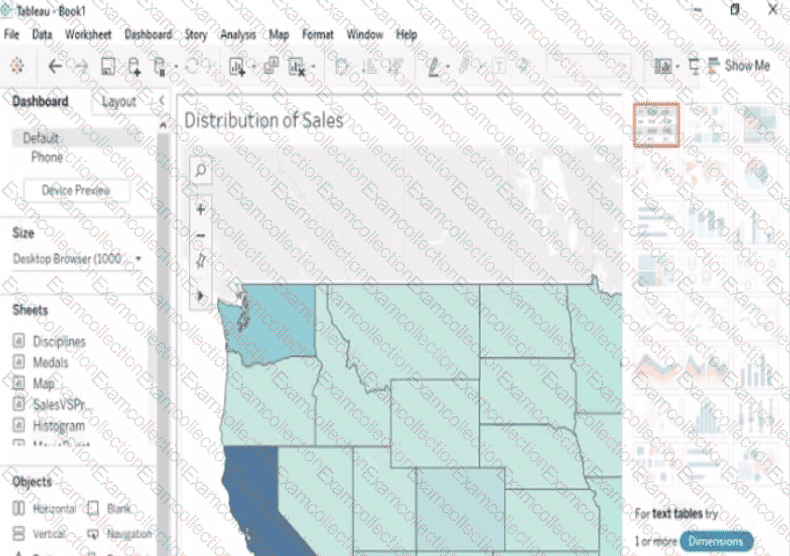
Create a filed map to show the distribution of total Sales by State across the United States.
Open the link to Book1 found on the desktop. Open the CategoryPercentage worksheet.
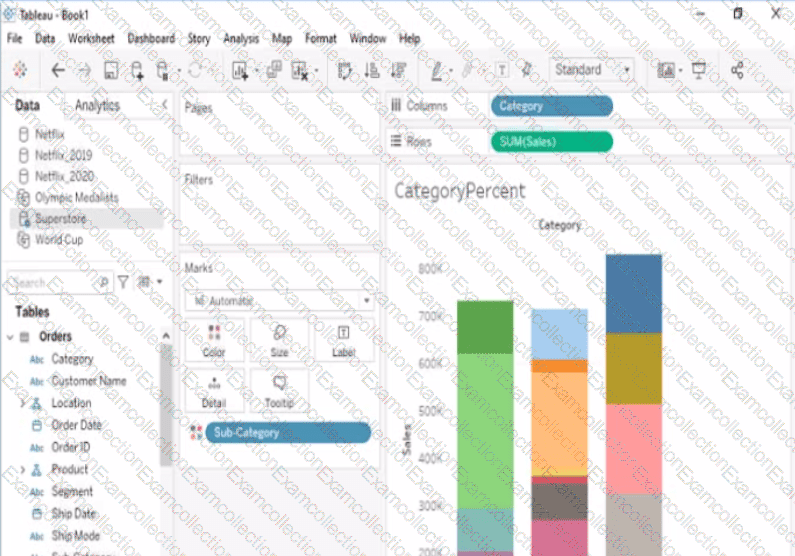
Modify the bar chart show the percentage of sales for each Subcategory within every Category. The total percentage for every Category must be 100%.
Open the link to Book1 found on the desktop. Open Disciplines worksheet.
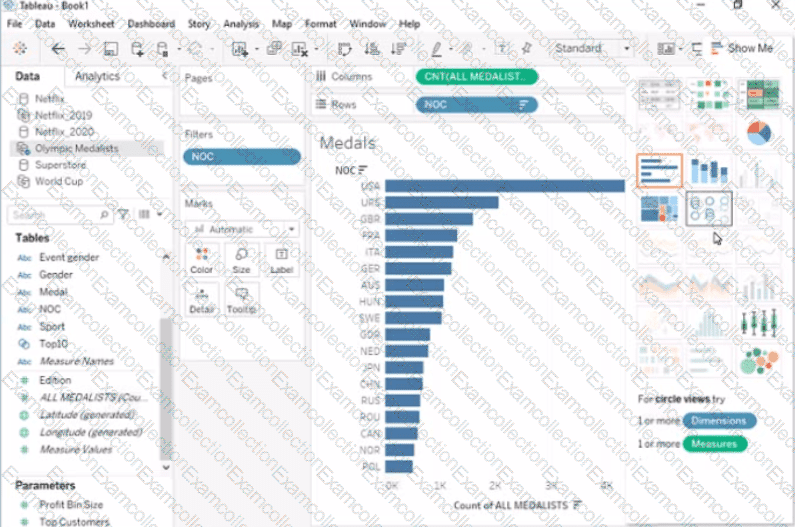
Filter the table to show the Top 10 NOC based on the number of medals won.
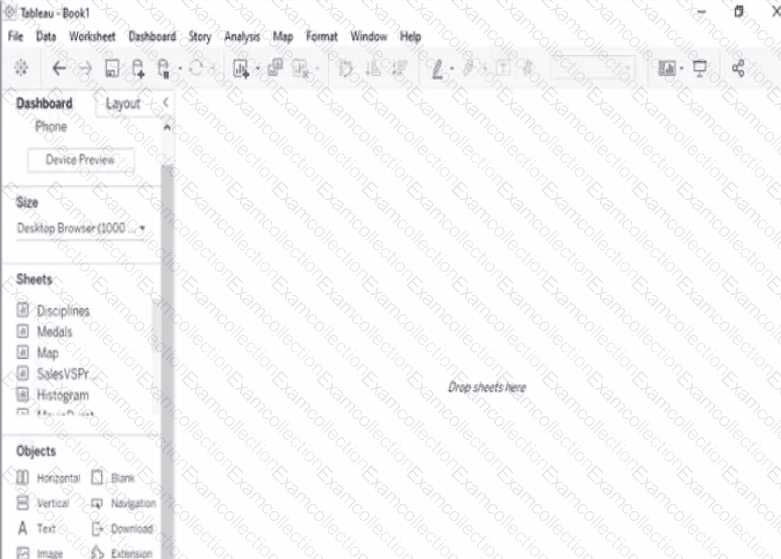
Open the link to Book1 found on the desktop. Open the sales dashboard.
Add the Sales by State sheet in a Show/Hide button to the right side of the dashboard.
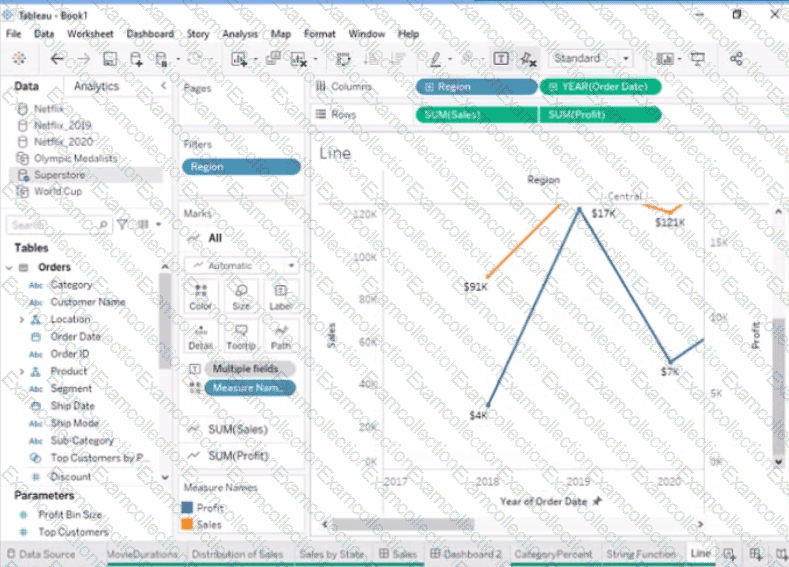
Open the link to Book1 found on the desktop. Open the Line worksheet.
Modify the chart to show only main and max values of both measures in each region.
Open the link to Book1 found on the desktop. Use the Superstore data source.
Split the Customer Name field into two fields named First Name and Last Name.