

WGU Applied-Algebra - WGU Applied Algebra FXO2 PFXP C957
The graph shows the number of trees sold by a nursery, where the number of days since the beginning of the month is along the horizontal axis and the number of trees sold per day is along the vertical axis. The greatest number of trees are sold when the temperature is over 70°F.
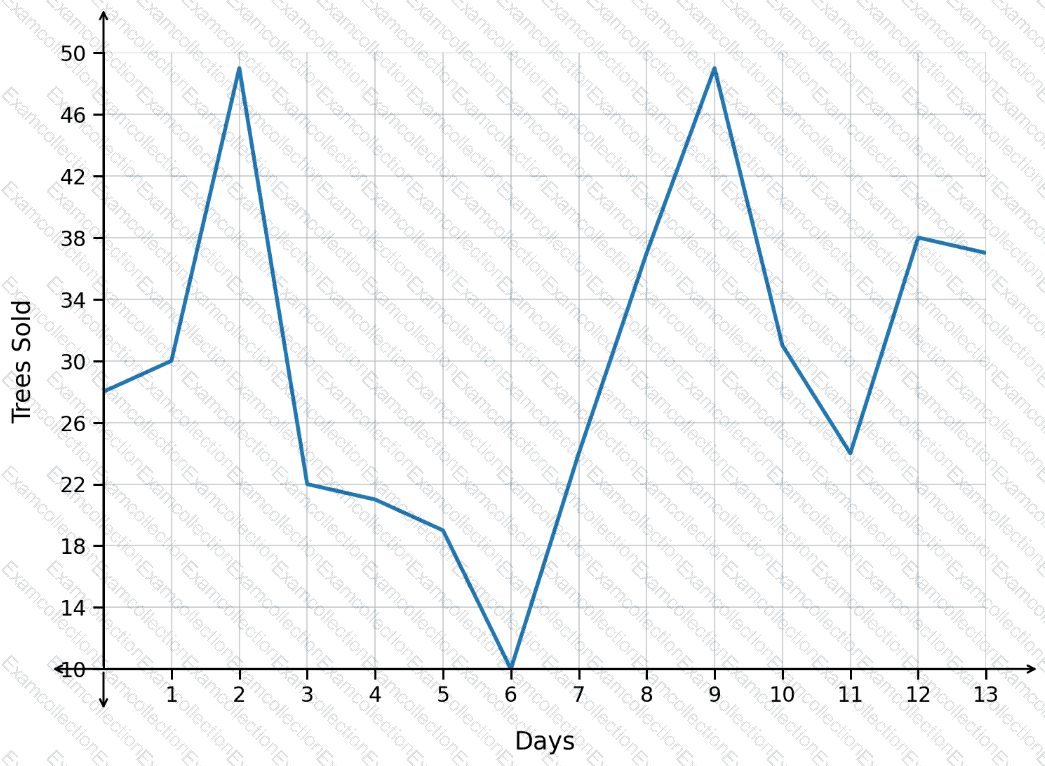
When was the temperature likely over 70°F?
The number of property sales in a region this year is expected to be 3 times the number of property sales in the region last year. The function H(x) represents the number of property sales this year, where x represents the number of properties sold last year. Which notation represents the number of property sales this year, given that the number of properties sold last year was 280?
As sacks are unloaded off a wagon, the total weight of the wagon and sacks changes. Each sack has the same weight. After 3 sacks are removed, the total weight of the cart and remaining sacks is 116 pounds. After 6 sacks are removed, the total weight is 101 pounds.
What is the weight of each sack?
The function p(t)represents the number of active players, p, in a game thours after 11:00 a.m. The graph of p(t)is shown.
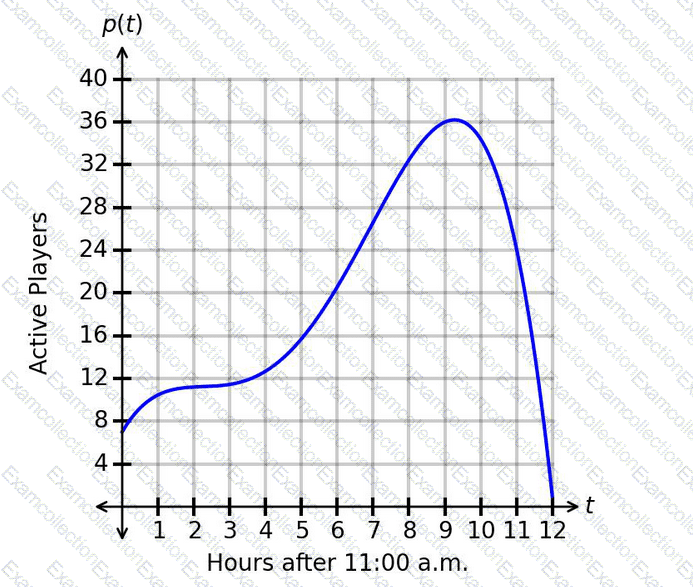
What is one example of an interval for which the number of players is decreasing faster and faster?
The logistic function f(x), whose graph is shown, models the number of registrants for an academic conference, where xrepresents the number of weeks since registration opened and f(x)represents the number of registrants.
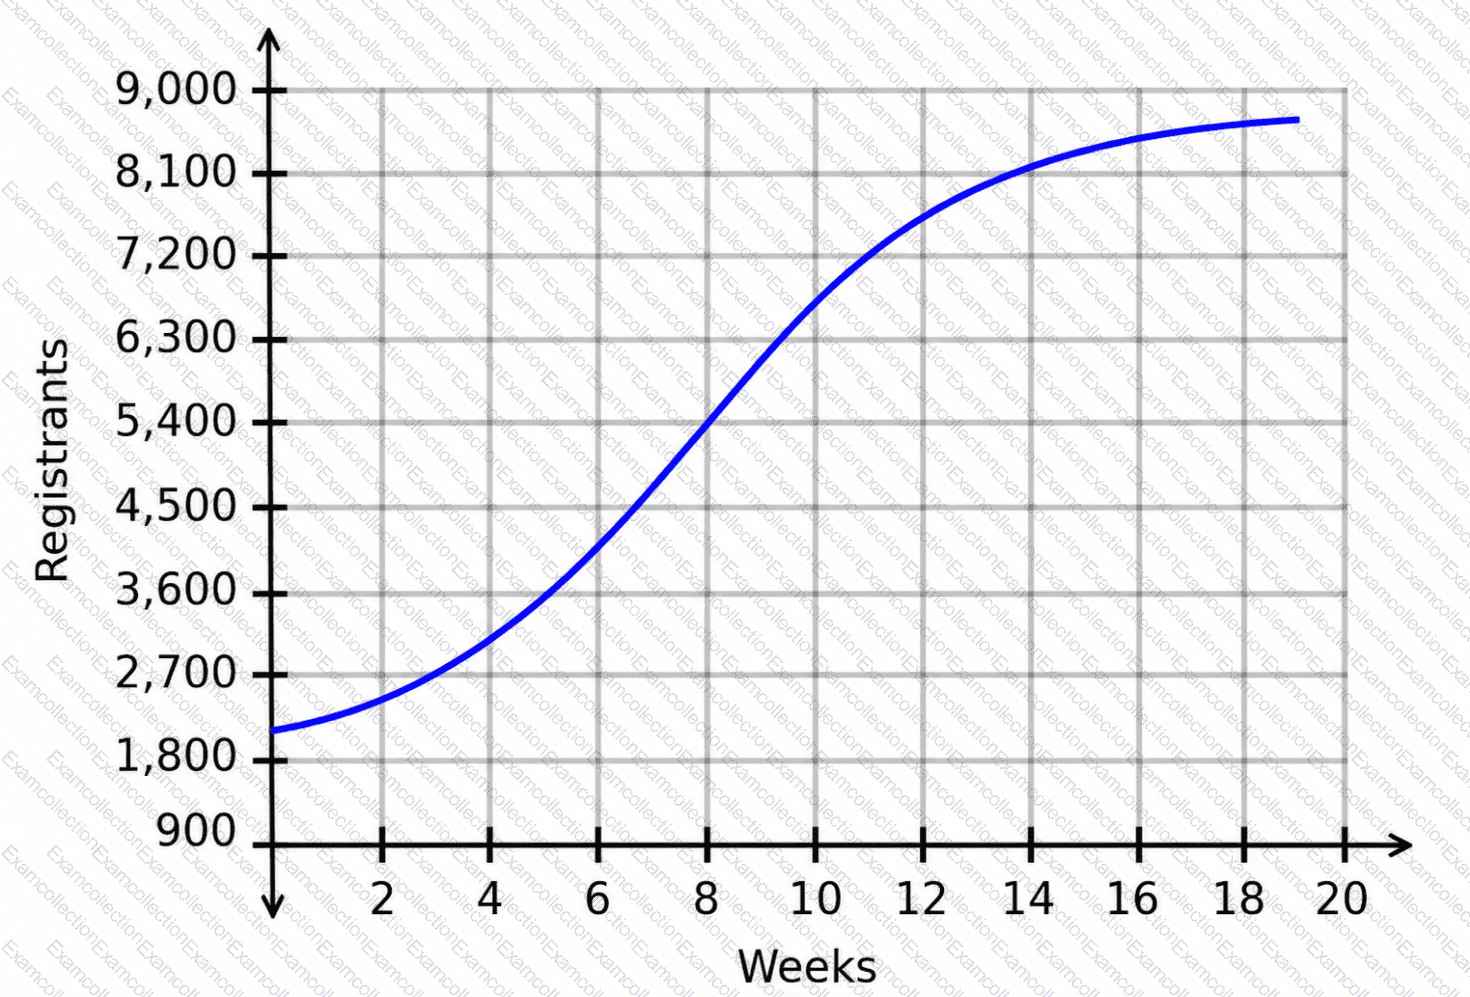
How does the number of registrants change as time progresses from week 1 to week 7?
The number of acres affected by an invasive species can be modeled using the logistic function f(x), where xrepresents the number of months since the species was introduced and f(x)represents the number of affected acres. The graph of f(x)is shown.
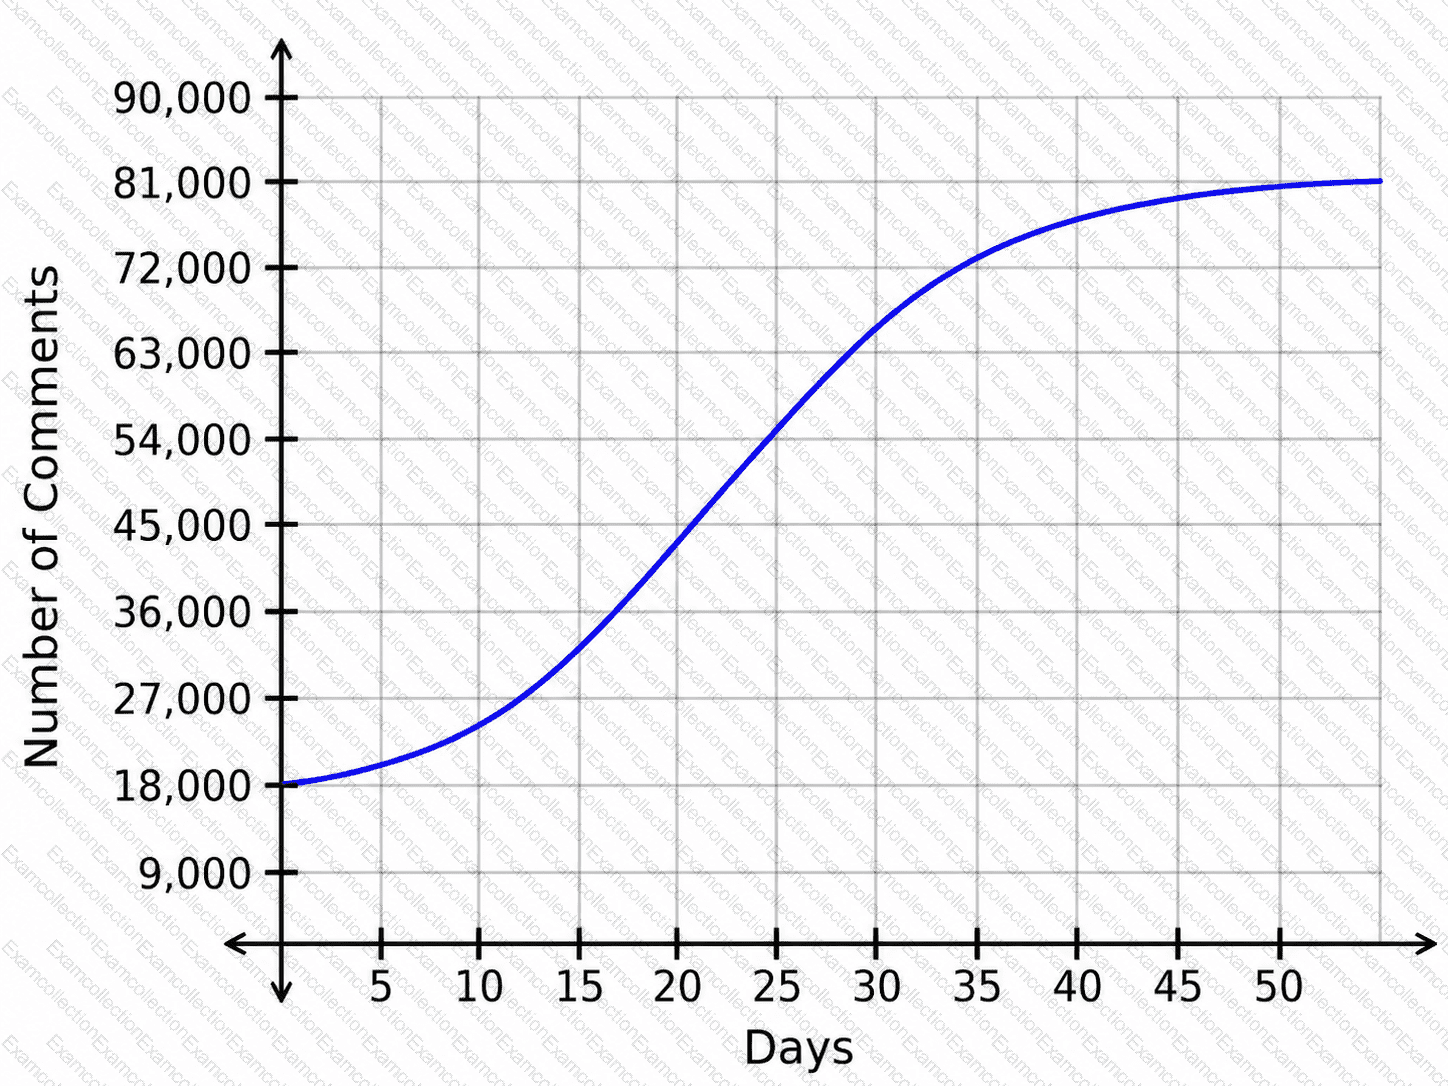
What happens as time progresses from month 2 to month 6?
The population of fish in a lake is changing according to the function
P(t)=24t+185
where tis the number of months since the beginning of the year and P(t)is the fish population at time t.
Which interpretation of the rate of change is correct?
The weekly number of players, P, in hundreds, on a gaming website is modeled by the graph. The horizontal axis shows the number of years since the website was launched.
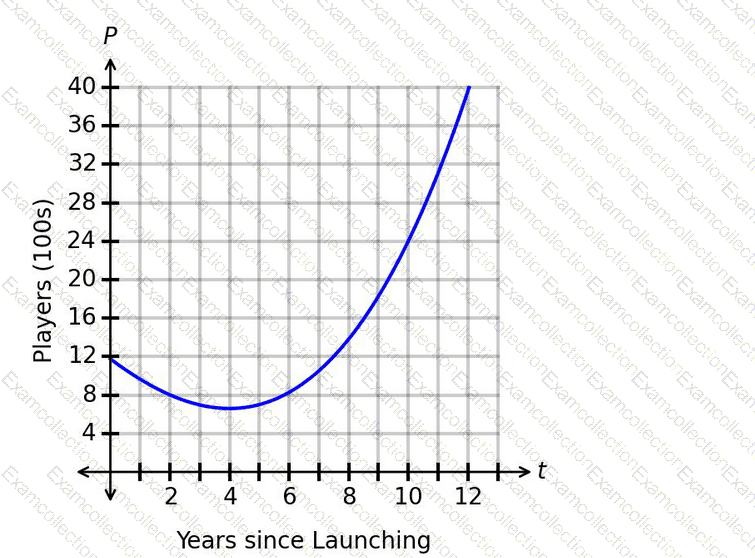
When did the website reach the minimum weekly number of players?
A small business is tracking the number of client accounts it manages over time. The graph shows the relationship between time and the number of client accounts the small business manages.
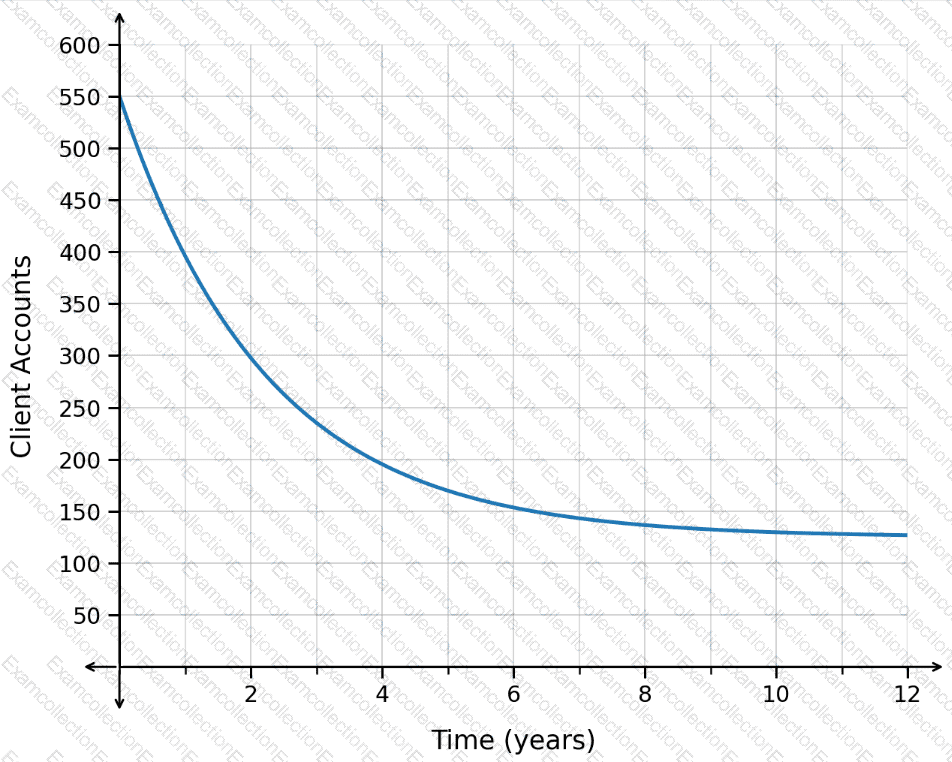
What is the equation of the horizontal asymptote?
The value of a collectible coin can be modeled by F(t), where t represents years since the number of years since the coin was found, and the vertical axis represents the value, in thousands of dollars.
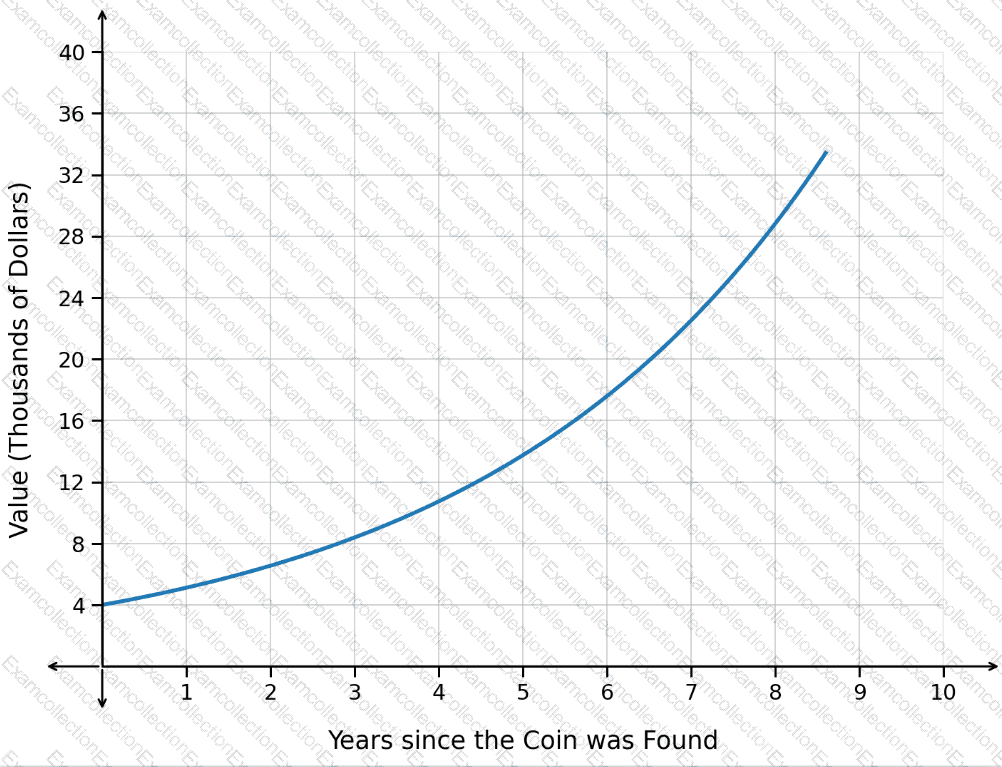
How is the value of the coin changing over time based on the graph?
