


WGU Applied-Algebra - WGU Applied Algebra FXO2 PFXP C957
A vehicle is traveling away from a town at a fixed rate. After 1 hours, the vehicle is 200 miles from the town. After 4 hours, the vehicle is 395 miles from the town.
Which function represents the distance, d, between the vehicle and the town after thours?
The exponential function
f(t)=2900(1.13)
t
represents the size of a bacteria population, where t is the time in hours.
How many bacteria are in the population when t=18?
In the graph showing the number of new customer accounts, the horizontal axis shows the number of weeks since the beginning of winter and the vertical axis shows the number of new customer accounts. More customer accounts are opened during snowy weeks than during weeks without snow.
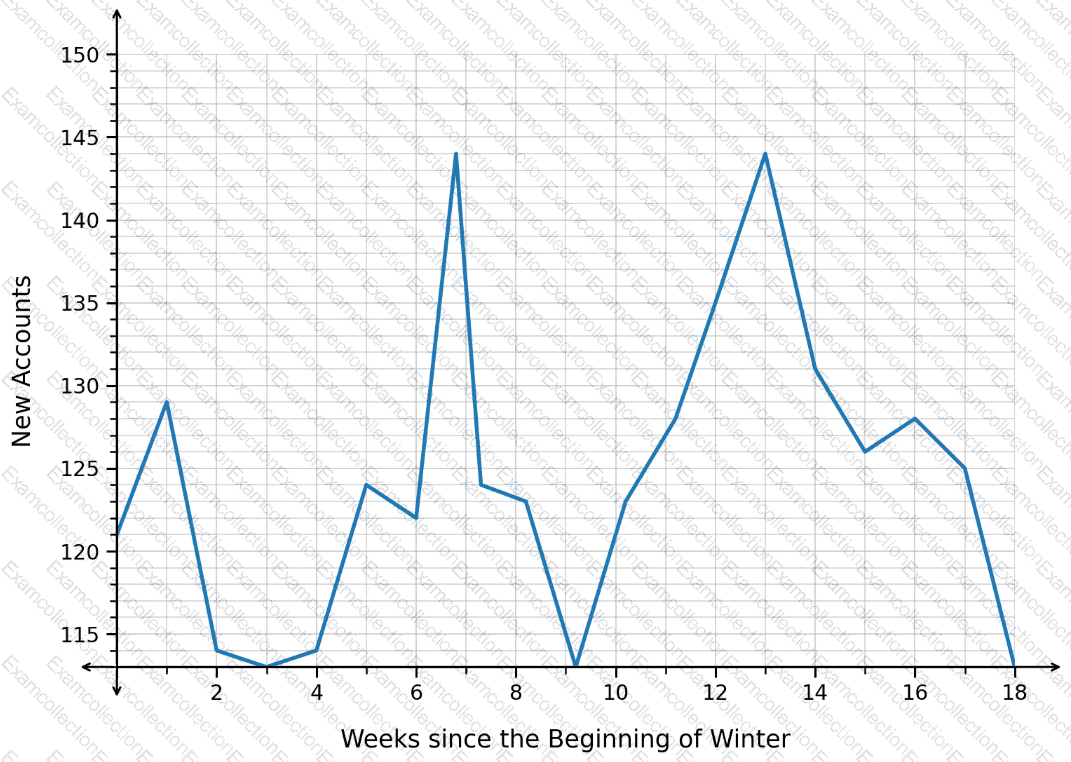
When was it likely snowy?
The graphed function n(t)represents the number of animals, n, at a feeding station thours after 5:00 a.m. The plotted points Aand Bhave coordinates (1│10.6)and (8│6.59).
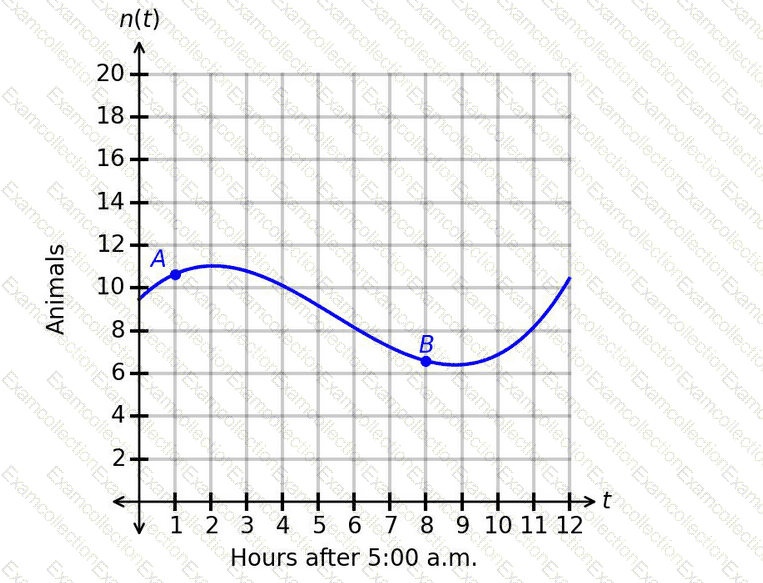
Which statement gives the correct interpretation of the average rate of change of the number of animals over the interval from point Ato point B?
The populations, in thousands, of two towns are shown in the graph, where the horizontal axis measures the time in years.
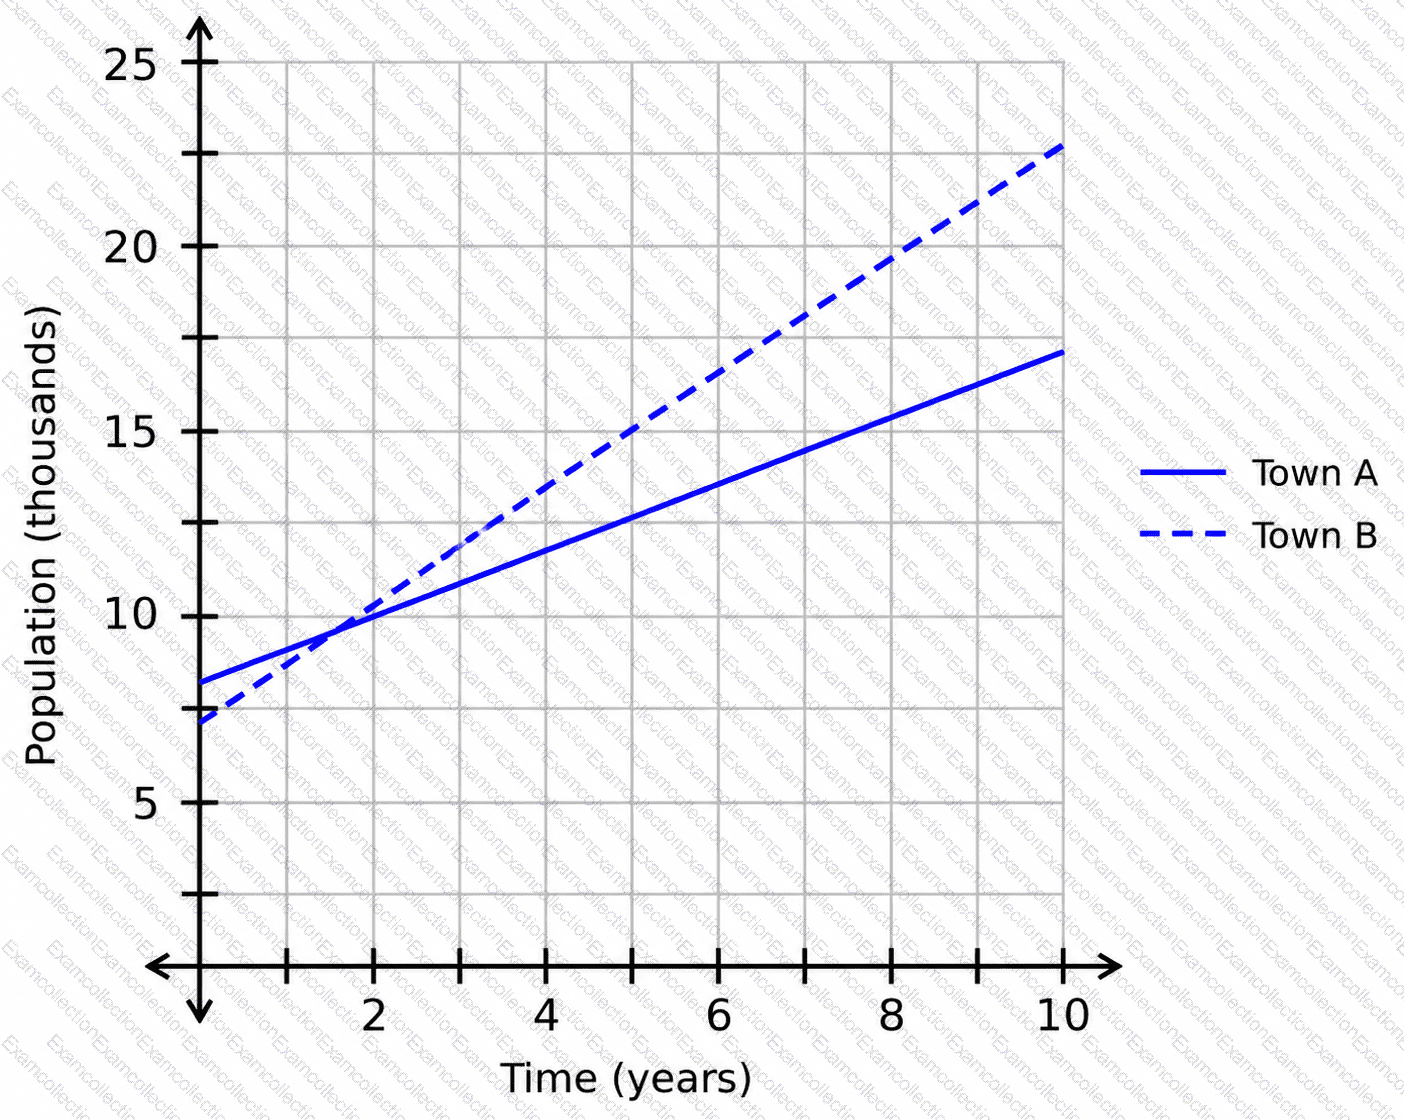
Which town’s population is growing at a faster rate?
The data in the scatterplot represents the number of people working at a research station over time. The graphed regression function has an r
2
value of 0.96. The predicted number of people working at the research station after 18.1 years is 541.
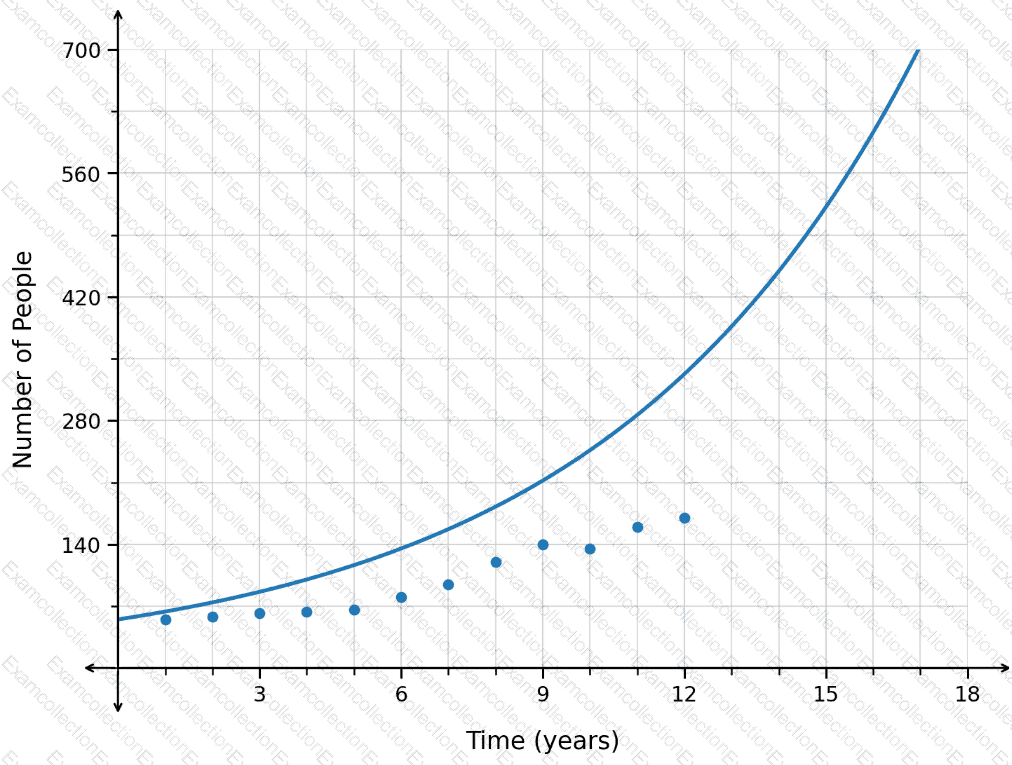
Is this prediction appropriate?
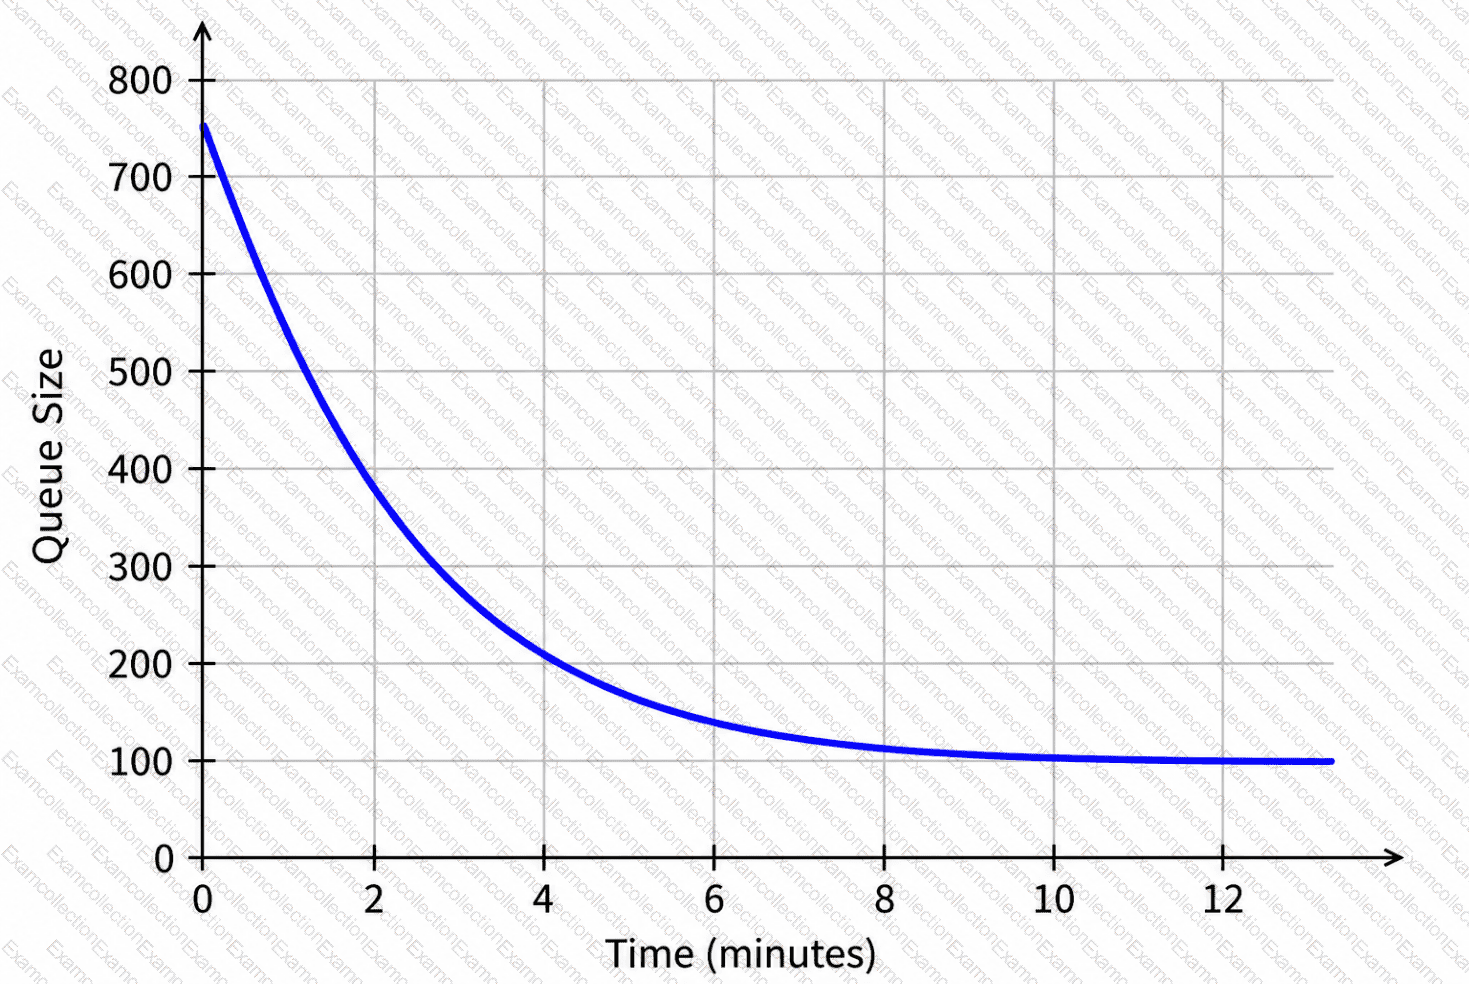
The graph shows the number of people waiting in a virtual queue to buy tickets for an event.
What does the horizontal asymptote mean?
The number of daily raffle tickets sold, R(d), for a fundraiser is represented by the graph, with the number of days since the beginning of the month along the horizontal axis and the number of raffle tickets sold for the day along the vertical axis.
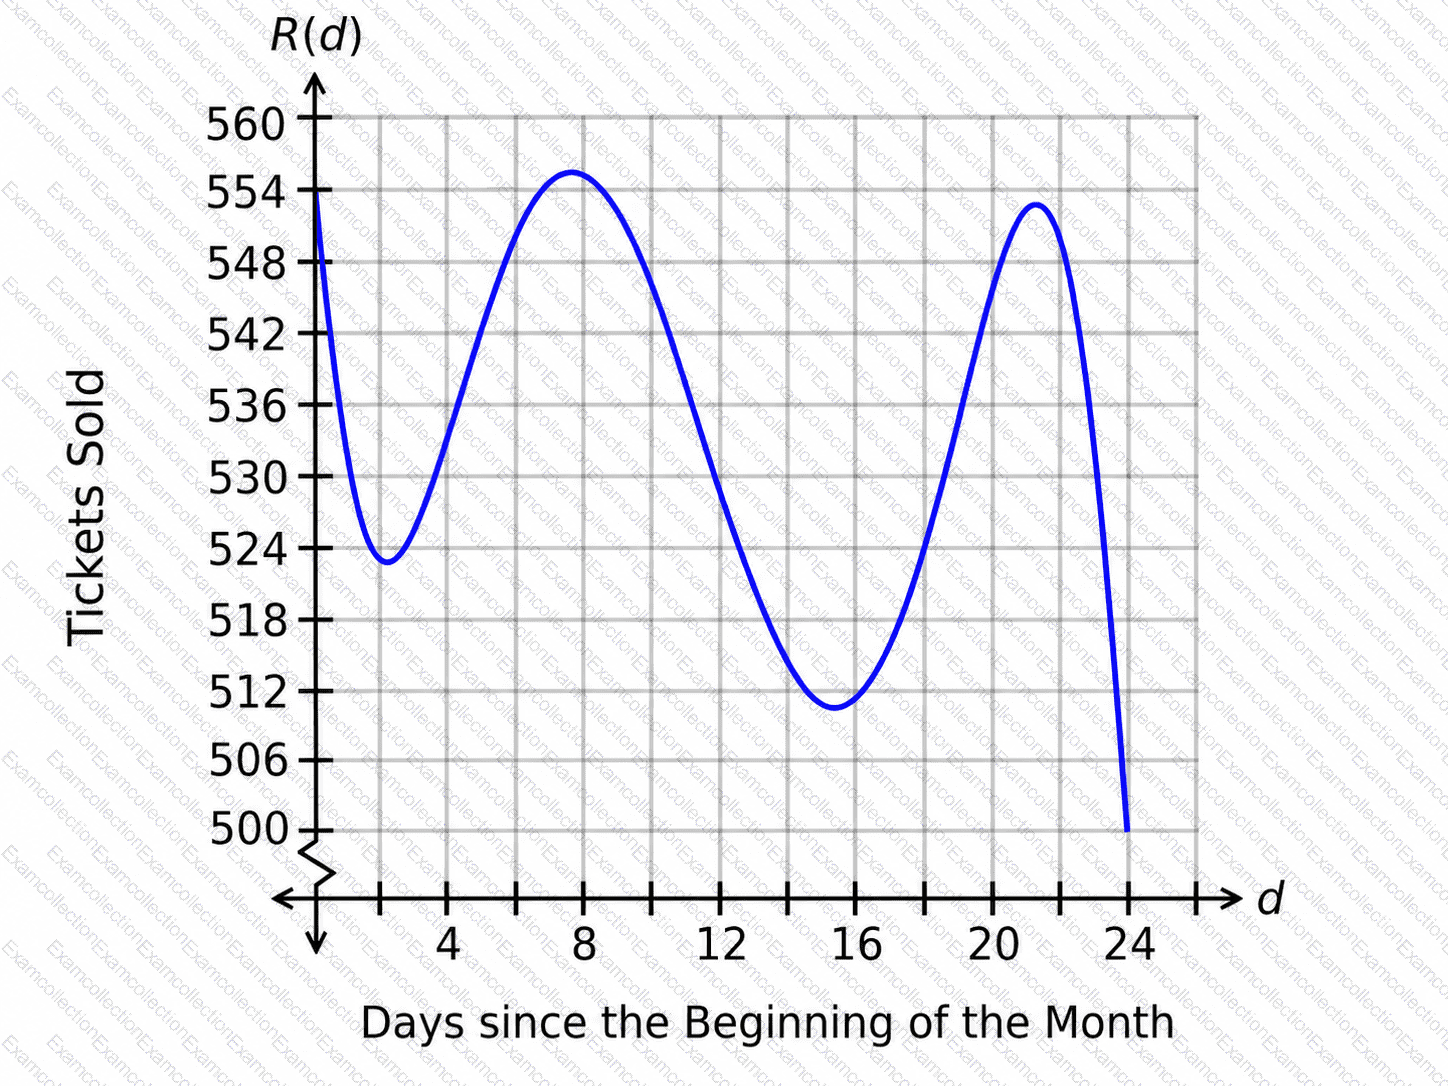
How can the concavity be described from d=0to d=4.4?
An investment account accrues interest every year, and the value of the account is given by G(x). The graph of this function is shown.
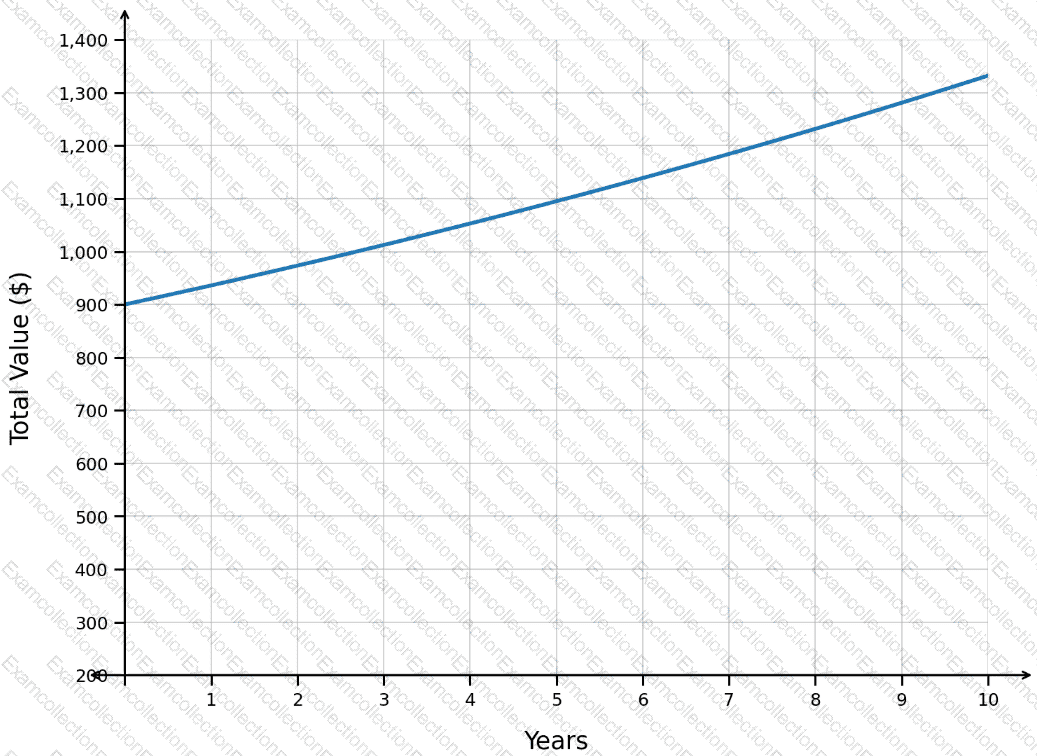
What represents the value of the account after 4 years?
The logistic function f(x), whose graph is shown, models the number of people who have created a website account, where xrepresents the number of days since the website started and f(x)represents the number of people who have created an account.
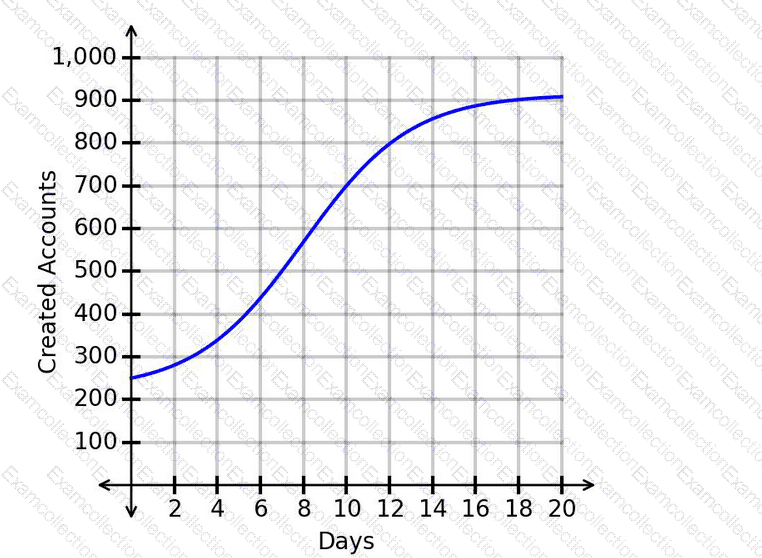
What is one range of values for which the graph is concave down?