


WGU Applied-Algebra - WGU Applied Algebra FXO2 PFXP C957
The number of registered voters in a district is modeled by a decreasing exponential function, where x represents the number of years since 2005 and f(x) represents the number of registered voters.
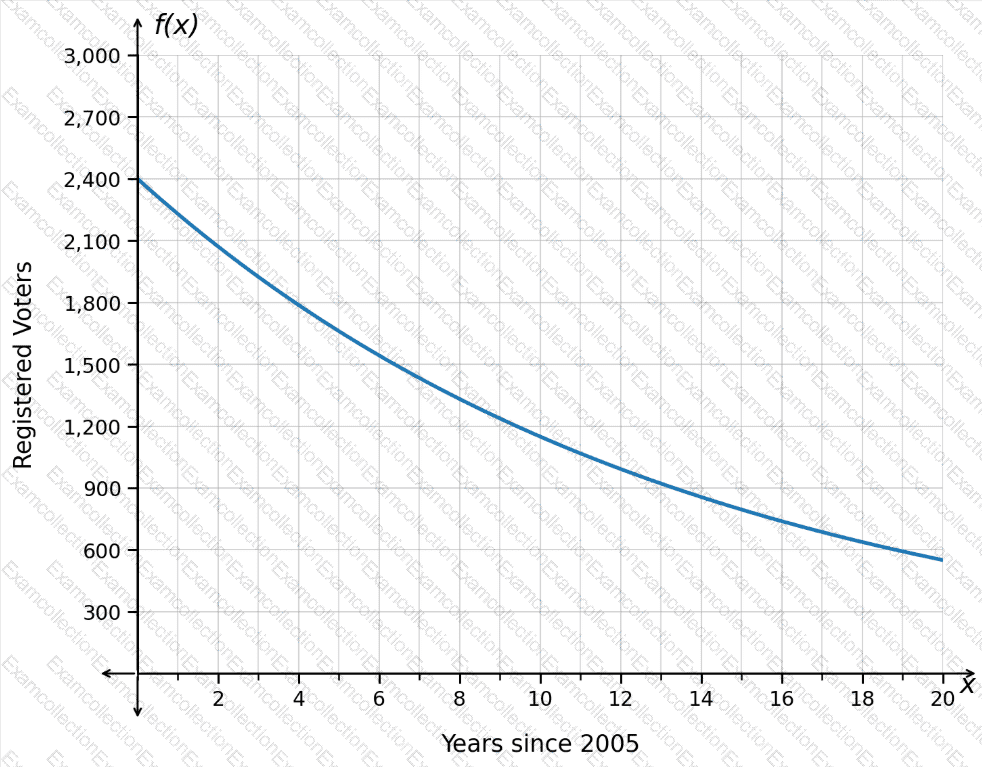
Which interval is associated with the slowest average decrease in the number of registered voters?
A set of data was gathered and used to create a model for the number of subscribers to a blog. The function model is
f(x)=190× 〖 0.99 〗 ^x
where xrepresents the number of years since 2003 and f(x)represents the number of subscribers.
What is the correct interpretation of the average rate of change of the number of subscribers from 2012 to 2015? Round to the nearest whole number, if necessary.
As regulations change, the number of licensed sellers of a product decreases. The graph models the change in the number of licensed sellers over time.
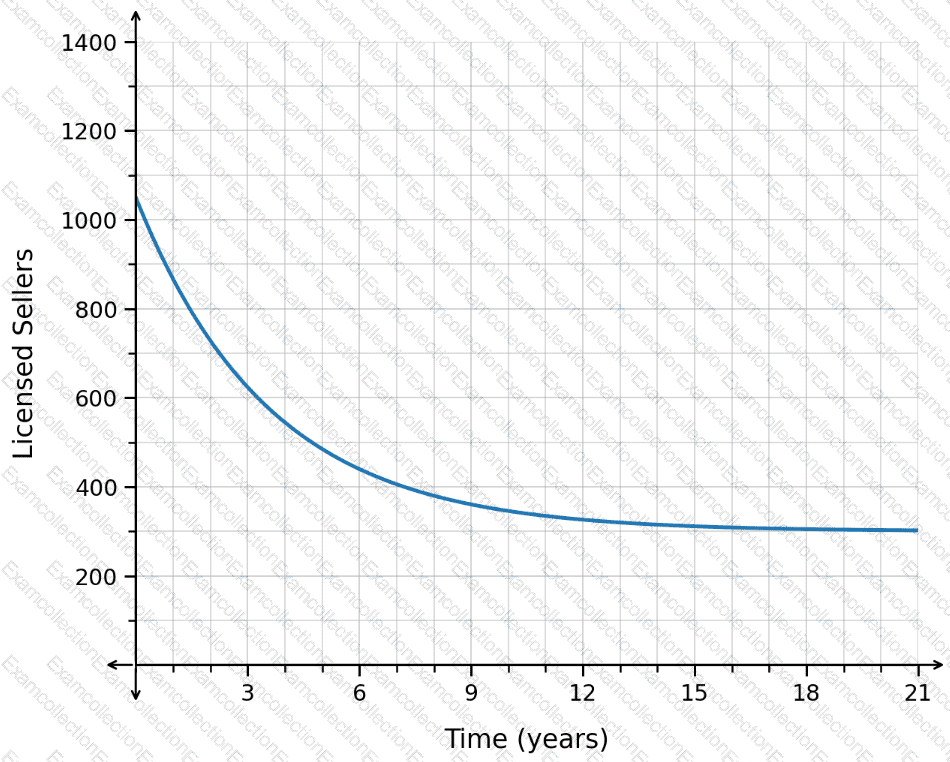
What does the horizontal asymptote mean?
A recipe calls for a constant ratio of water and lemon juice. The graph shows the relationship between the amounts of these two ingredients, where wis the volume of water and lis the volume of lemon juice.
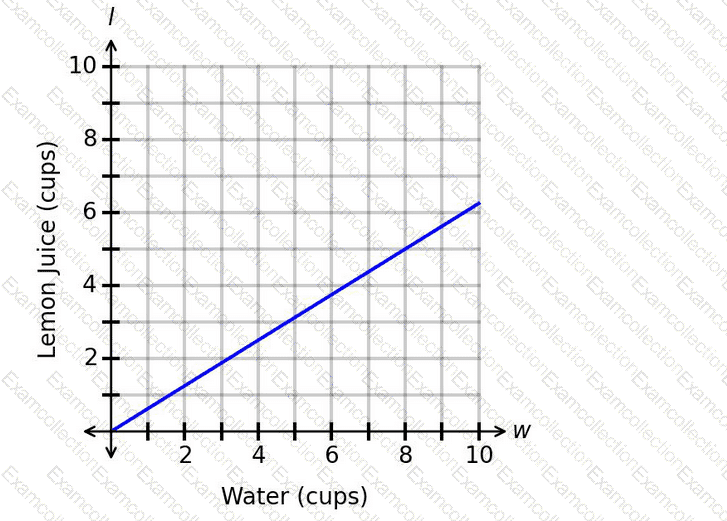
What is the correct interpretation of the rate of change?
The graph shows the number of customers, C(t), showing up to a store, where the number of hours since opening is along the horizontal axis and the number of customers showing up to the store each hour is along the vertical axis.
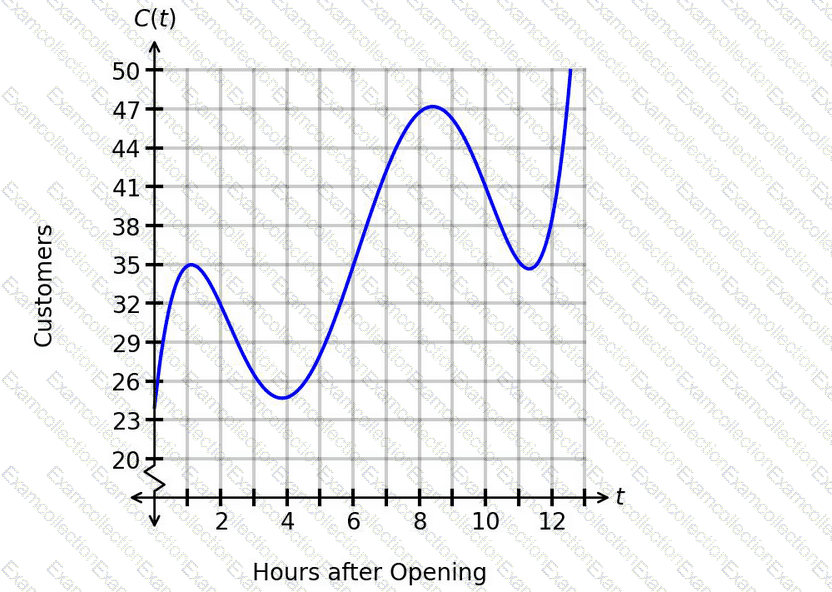
How can the concavity be described from t=6.2to t=10.1?
The figure shows the graph of x(t), which represents the number of users, x, watching a live video thours after 9:00 a.m.
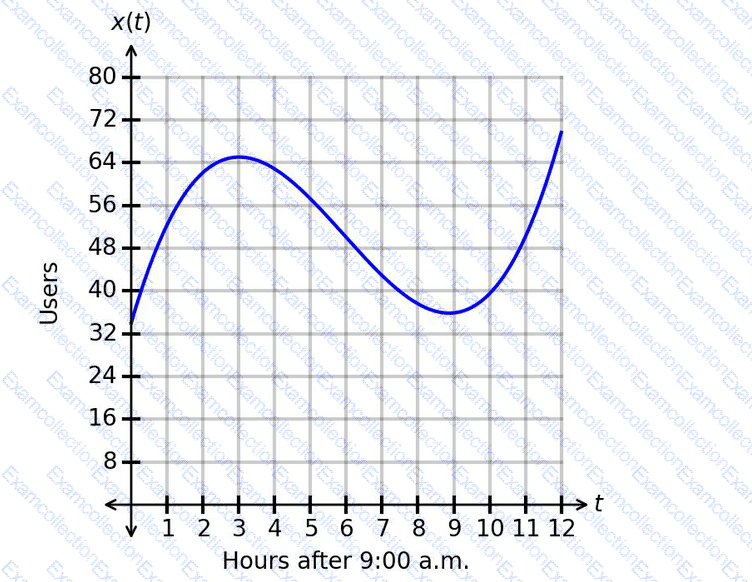
Which interpretation of the concavity between t=3.2and t=5.7is correct?
The function N(t)models the number of subscribers to a virtual newsletter over time. The graph of N(t)is shown. The horizontal axis represents the number of years since the newsletter started, and the vertical axis represents the number of subscribers, in thousands.
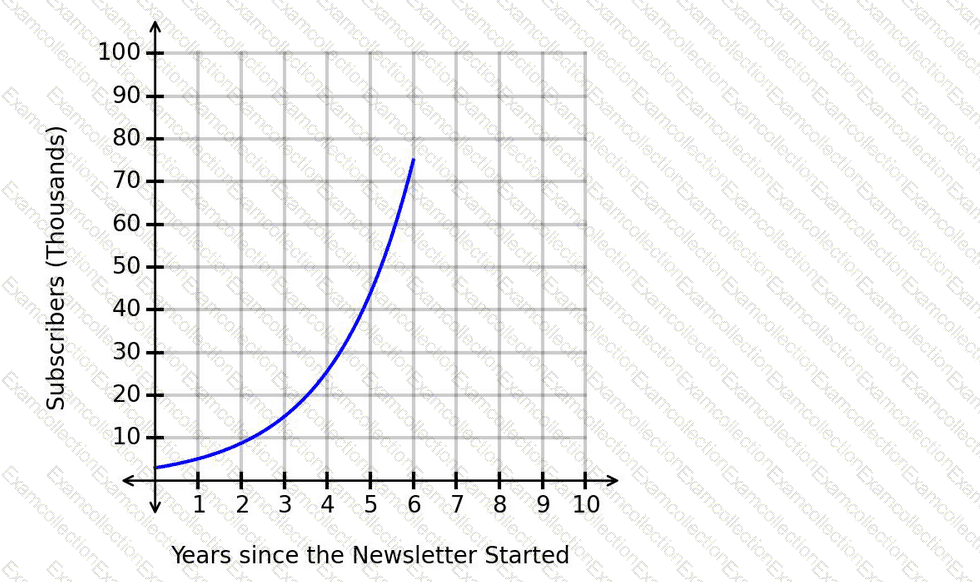
How is the number of subscribers changing over time based on the graph?
A person makes down quilts to sell.
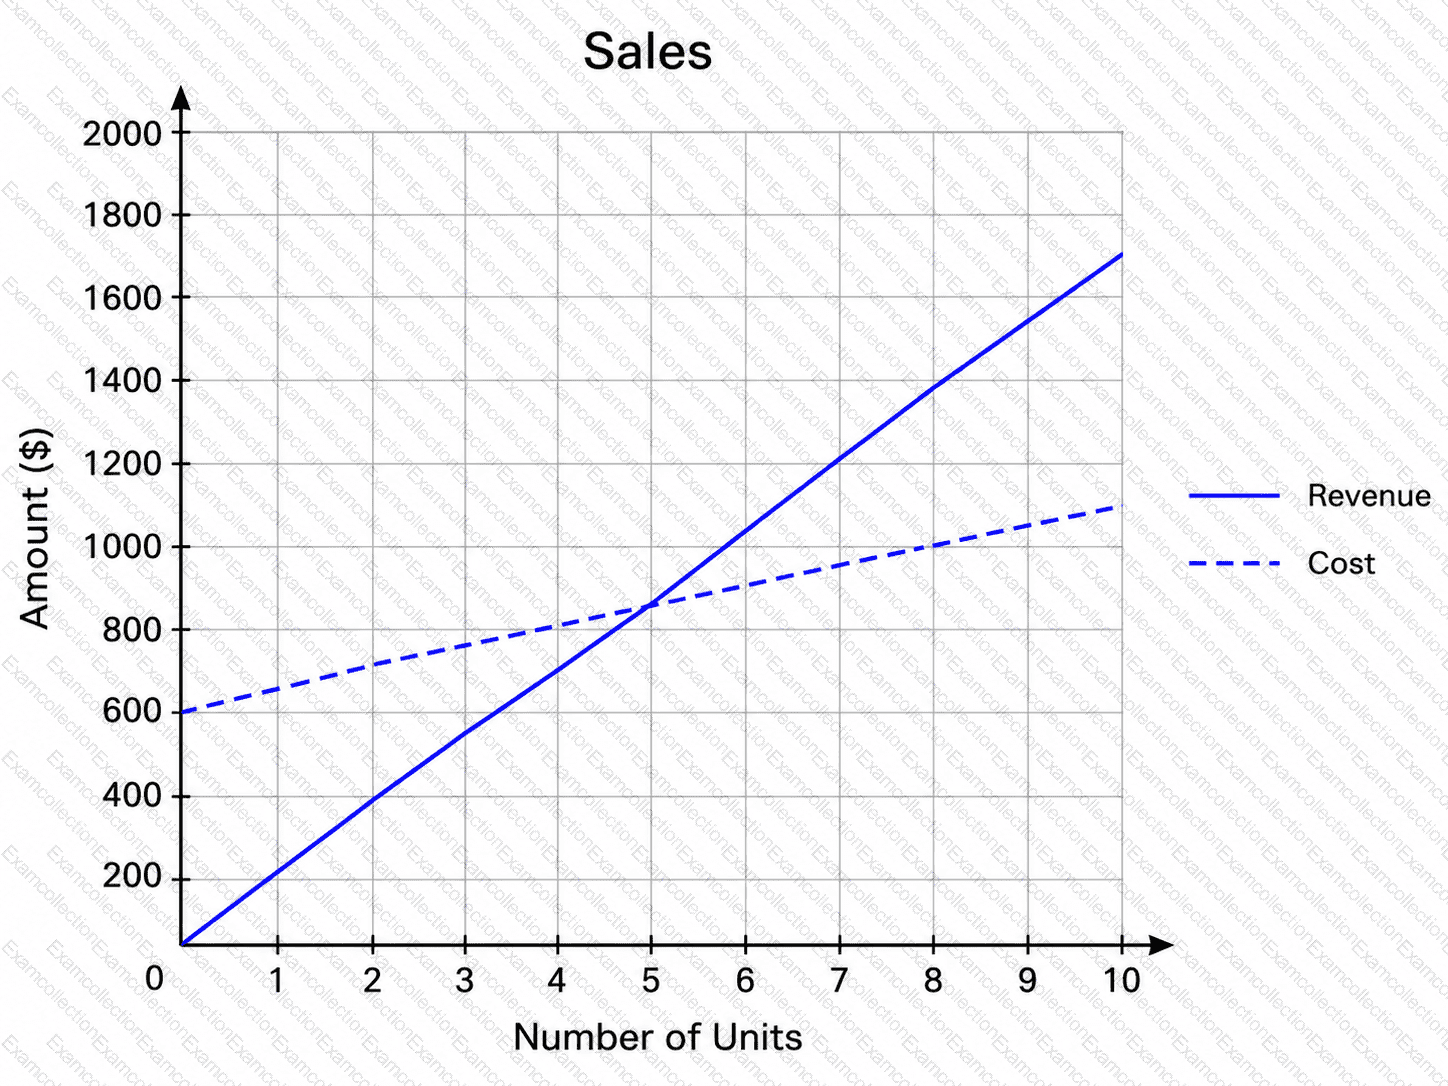
The graph shows the functions that model the cost and revenue.
How many down quilts need to sell to break even/start making a profit?
The graph shows the daily practice duration for a musician, where the number of days since the beginning of the month is along the horizontal axis and the number of minutes practiced per day is along the vertical axis.
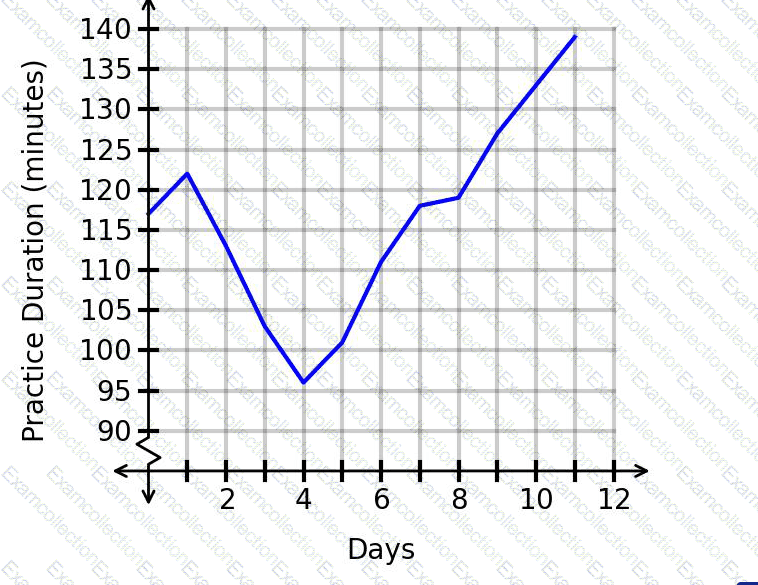
What was the practice duration for day 9, based on the graph?
The graph shows the number of customers visiting a bookstore, where the number of days since the beginning of the month is along the horizontal axis and the number of customers visiting the bookstore each day is along the vertical axis. More customers show up to the store on days when new releases are featured than on other days.
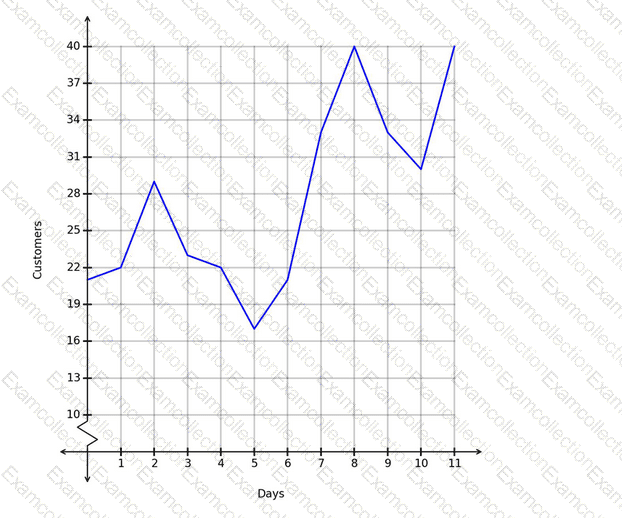
Which days likely featured new releases?