

ServiceNow CIS-PA - Certified Implementation Specialist - Platform Analytics
A filtered Time Series widget shows individual trends for the number of open incidents with High and Critical priorities.
Which action configures the Responsive Canvas Dashboard to show acombined trendfor the Critical and High-priority incidents?
Which Breakdown is most likely to use a Bucket Group as its Breakdown Source?
When using aBucket Groupas a Breakdown Source, which is the required Breakdown SourceFacts table?
Which definition best describes theKPI Detailsapplication?
Where areNext Experience DashboardsandData Visualizationscreated?
What should thetargetfor theIndexand its supporting indicators be set to when creating anIndex Indicator?
You see this error in aBreakdown Source:
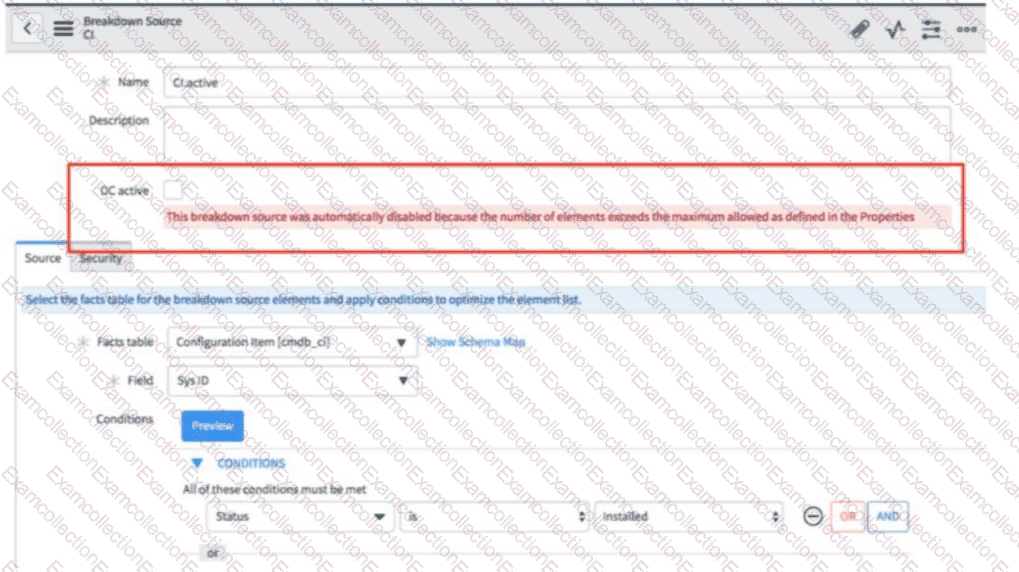
Which action resolves the issue?
Where should you navigate to activate aPerformance Analytics Content Pack?
When areAdditional conditionsof an Indicator evaluated duringData Collection?
Which definition describes the functionality of aFormula Indicator?
