

GAQM CLSSBB - Certified Lean Six Sigma Black Belt (CLSSBB)
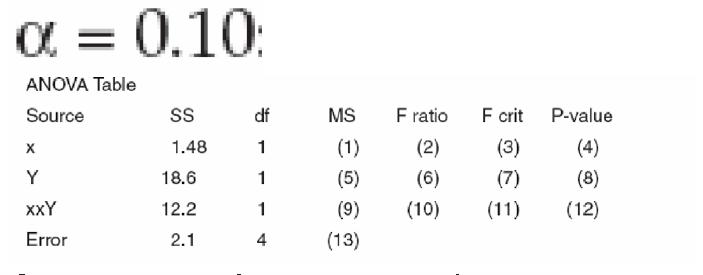
Find the value of (2) in the ANOVA table. Assume:
A team wants a technique for doing an initial study of a process that not every team member is familiar with. They should use:
SCENARIO
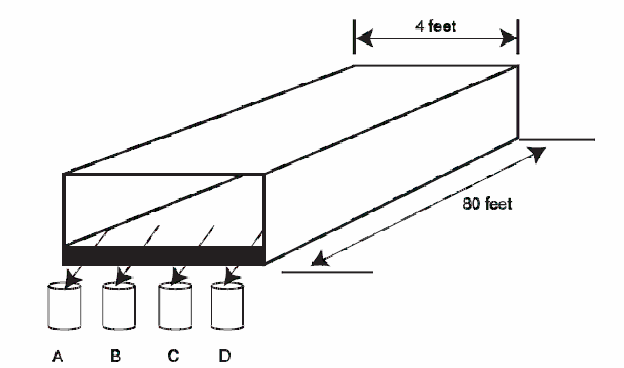
A Six Sigma team is measuring the moisture content of corn starch as it leaves the conveyer belt of a dryer. They collect one sample four cups of starch at times indicated in the chart at fixed locations labeled A, B, C, and D across the end of the belt. See the diagram below.
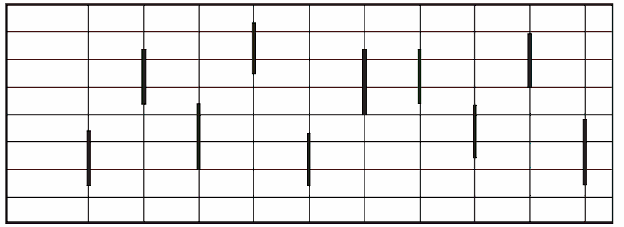
After some work on the dryer, additional data are collected which when plotted looks like this:
Which type of variation dominates?
A population of size 1,000,000 has mean 42 and standard deviation 6. Sixty random samples, each of size 15 are selected. According to the Central Limit Theorem the distribution of the sixty sample means has a mean of approximately:
Which of the following tools is used extensively in quality function deployment (QFD)?
A and B are events. P(A) = 0.80 and P(B) = 0.90
Proposed Six Sigma projects that are not in some way linked to organizational goals:
A process shows the following number of defectives. Each sample size for this process is
85.3 8 2 7 7 6 8 8 9 5.
What control chart should be used?
Find Cpk
An advantage of using standard deviation rather than range for measuring dispersion of a large sample is that:
