

CompTIA DA0-001 - CompTIA Data+ Certification Exam
A data analyst needs to create a master file that includes customer information from the tables below:
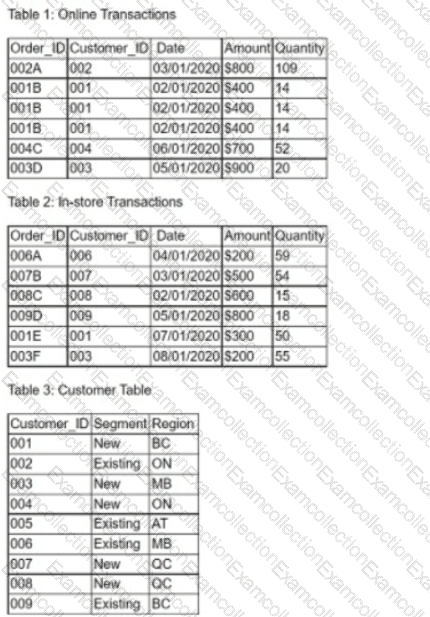
Given the three tables above, the analyst wants to filter down the information prior to joining it together. In which of the following orders should this data manipulation bo approached for the most efficient result?
Given the following table of student scores (with some values that violate the allowed scoring rules), which of the following is the best reason for cleansing the data?
A company wants to know how its customers interact with an e-commerce website based on clicks over items. Which of the following is the primary requirement for this report?
A data analyst is creating a dashboard and trying to identify the type of information that should be included. Which of the following should the analyst consider first?
A database administrator is required to mask certain table columns containing PII in order to comply with the company privacy policy. Which of the following are the most likely types of information the administrator should mask? (Select two).
You are working with a dataset and need to swap the values in rows with those in columns.
What action do you need to perform?
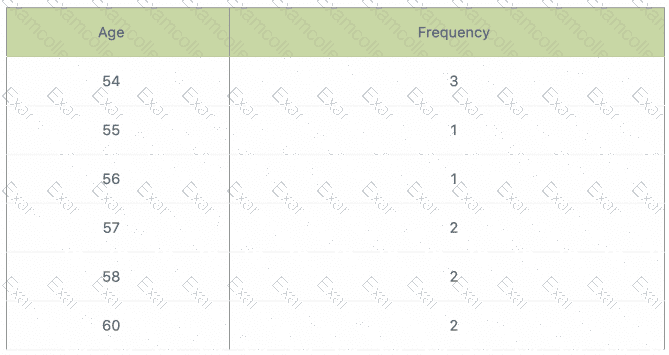
Consider this dataset showing the retirement age of 11 people, in whole years:
54, 54, 54, 55, 56, 57, 57, 58, 58, 60, 60
This tables show a simple frequency distribution of the retirement age data.
A client has requested an analysis of all pet care items purchased by current customers and their social media connections in the past 12 months. Which of the following data analysis techniques would be the best choice given these requirements?
