

IASSC ICBB - IASSC Lean Six Sigma – Black Belt
A dock worker for a feed supplier was tasked with assuring the proper weight in the feed bags as they left the dock. One of the columns listed the range of weight of the bags included in the studies. This required plotting a Histogram of the weight of the bags. While drawing the Histogram the x-axis contained a certain scale of data. Pick the scale of data that is appropriate for Histograms.
Fractional Factorial, ____________and Response Surface Method are types of planned experiments.
Control Charts were developed by Dr. Shewhart to track data over time. To detect Special Cause variation the Control Charts use which of these?
The method of Steepest Ascent guides you toward a target inside the original inference space.
Assessing process proportion as opposed to evaluating a process with respect to a set target can be done using one or more of these. (Note: There are 2 correct answers).
When analyzing the behavior of our process to assess customer satisfaction we are concerned about both the variation such that it stays within the spec limits and how well the Mean is __________________ the process requirements.
Sally and Sara sell flower pots at their garage sale. Martha motivates Rose mentioning that they will sell a minimum of 16 pots per day if the outside temperature exceeds 60o F. From a sample, whose population is assumed to follow a Normal Distribution, taken for 30 days at 60 degrees or more an average of 15.2 pots per day were sold with a Standard Deviation of 0.6 pots. What is the Z value for this sales process?
A valid mathematical Regression represents all of the characteristics shown except _________________.
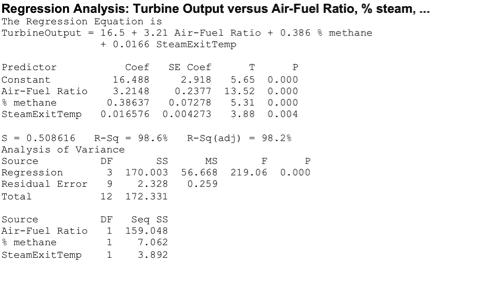
Which statement(s) are incorrect for the Regression Analysis shown here? (Note: There are 2 correct answers).
The Control Limits width varies if the sample size varies for which type of chart?
