

IASSC ICBB - IASSC Lean Six Sigma – Black Belt
The reported Cpk for a process with an average of 98 units, a spread of 16 units and upper and lower specification limits of 115 and 90 units would be?
A ___________ is used primarily to track the stability of the average value of a metric of interest.
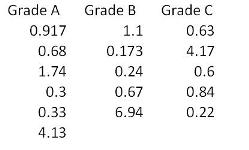
For the data set shown here which of these statements is/are true?
One of the foundations of Lean Six Sigma is the concept that the output of a process (Y) is influenced by the process inputs (X’s) and is commonly shown as which formula?
If a process has subgroups for Variable data and the process runs for a long period of time, then the best pair of SPC Charts to use would be an Xbar and _________.
An operator checks that all boxes being packed contain enough products to fill the box. However, each box getting filled has a different number of products in it. This is a Reproducibility problem, not a Repeatability problem.
An ANOVA used across many dependent variables could increase the Beta risk.
A Full Factorial experiment using a 2 level 4 factor approach has been proposed to test the viability of an extrusion machine experiment. How many treatment combinations will this approach involve?
Which one of these tools is frequently used to help drill down to possible causes once a Fishbone Diagram is constructed?
Measurement __________ is defined as the difference between the observed and the expected values for a given set of data.
