

IASSC ICBB - IASSC Lean Six Sigma – Black Belt
Which statements are correct about the advanced Capability Analysis shown here?
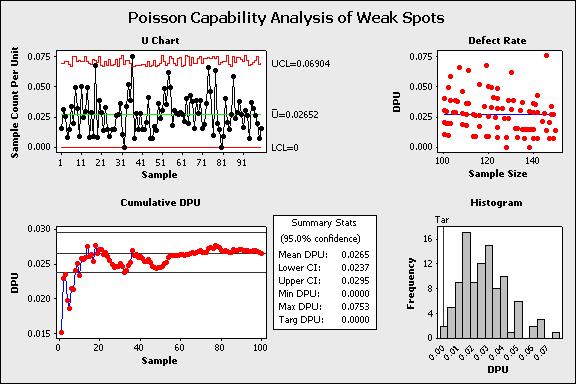
(Note: There are 3 correct answers).
Which of these are examples of business metrics or Key Performance Indicators commonly referred to as KPI’s?
For the data shown here which statement(s) are true? (Note: There are 2 correct answers).
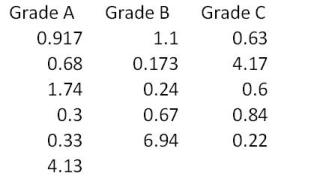
The _____________ Distribution would be the most desirable for modeling the number of stitch defects in a portion of fabric.
Two of the key deliverables for the Measure Phase are a robust description of the process and its flow and an assessment of the Management System.
If an experiment has 5 factors and no replicates for a 2-level Experimental Design with 16 experimental runs which statement(s) are correct? (Note: There are 3 correct answers).
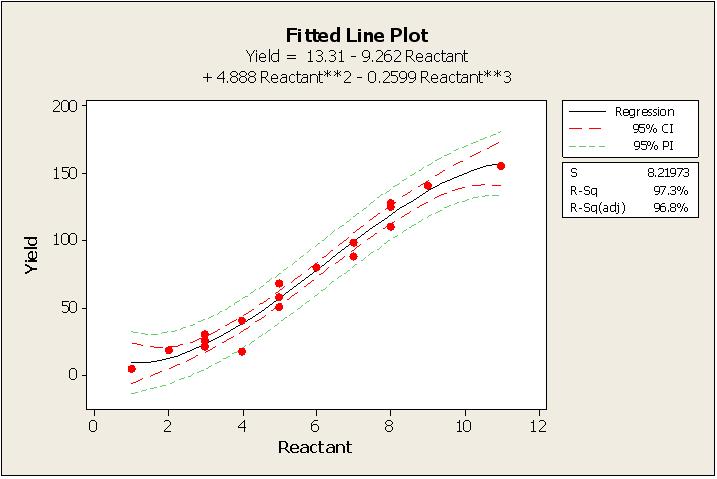
Which statement is NOT correct about the Fitted Line Plot shown here?
As a means of measuring the effects on other areas of a process as a result of changes in the primary metric we also define and track ________________.
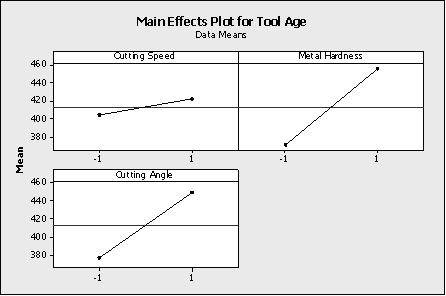
Which statement(s) are correct about the DOE Factorial plot output here? (Note: There are 3 correct answers).
Statistical Difference is the magnitude of difference or change required to distinguish between a true difference, brought about by change or improvement, and one that could have occurred by chance.
