

Microsoft PL-300 - Microsoft Power BI Data Analyst
You have a Microsoft Power BI data model that contains three tables named Orders, Date, and City. There is a one-to-many relationship between Date and Orders and between City and Orders.
The model contains two row-level security (RLS) roles named Role1 and Role2. Role1 contains the following filter.
City[State Province] = "Kentucky"
Role2 contains the following filter.
Date[Calendar Year] = 2020
If a user is a member of both Role1 and Role2, what data will they see in a report that uses the model?
Note: This question is part of a series of questions that present the same scenario. Each question in the series contains a unique solution that might meet the stated goals. Some question sets might have more than one correct solution, while others might not have a correct solution.
After you answer a question in this section, you will NOT be able to return to it. As a result, these questions will not appear in the review screen.
You have a data source that contains a column. The column contains case sensitive data.
You have a Power BI semantic model in DirectQuery mode.
You connect to the model and discover that it contains undefined values and errors.
You need to resolve the issue.
Solution: You implicitly convert the values into the required type.
Does this meet the goal?
You have a collection of reports for the HR department of your company.
You need to create a visualization for the HR department that shows a historic employee counts and predicts trends during the next six months.
Which type of visualization should you use?
You use Power Query Editor to preview the data in a column named Resource Location.
The column statistics and value distributions of Resource Location appear as shown in the following exhibit.
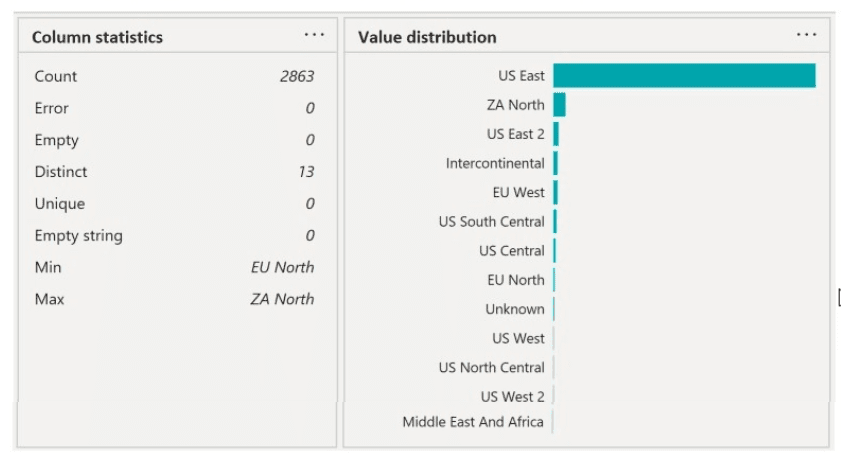
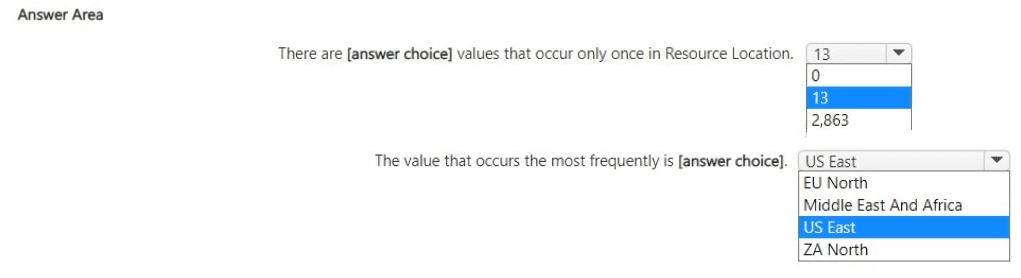
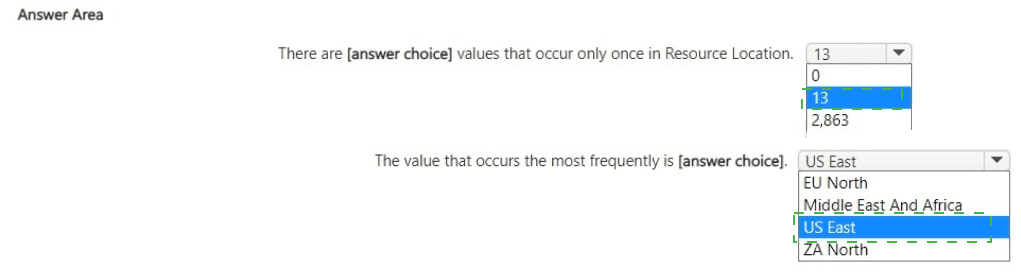
Use the drop-down menus to select the answer choice that completes each statement based on the information presented in the graphic.
NOTE: Each correct selection is worth one point.
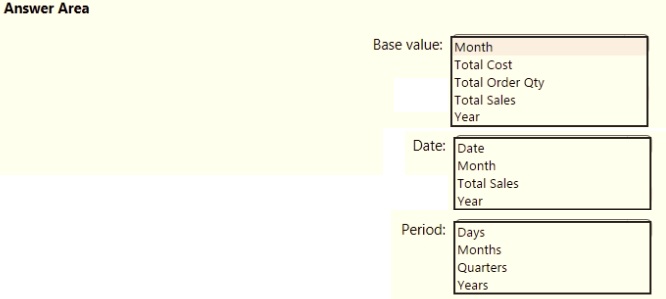
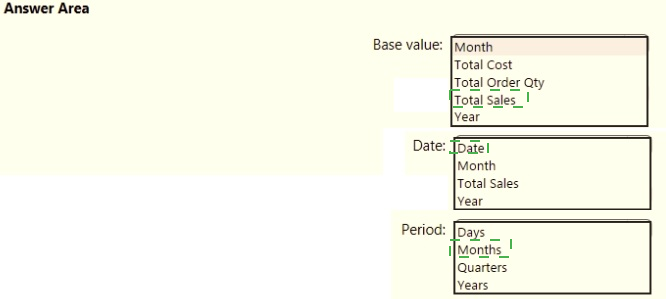
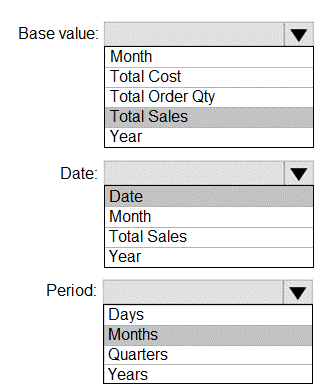
You are creating a quick measure as shown in the following exhibit.
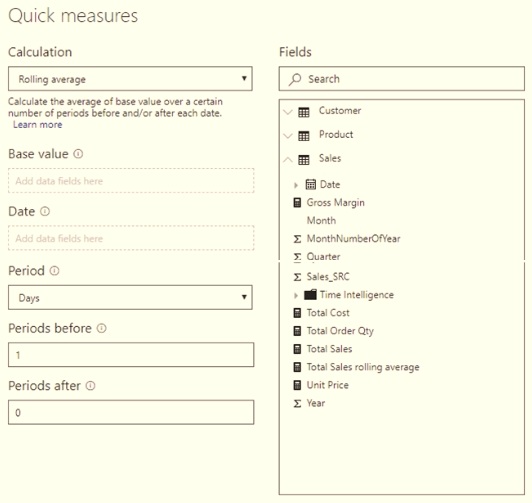
You need to create a monthly rolling average measure for Sales over time-How should you configure the quick measure calculation? To answer, select the appropriate options in the answer area.
NOTE: Each correct selection is worth one point.
You are creating a report in Power BI Desktop.
You load a data extract that includes a free text field named coll.
You need to analyze the frequency distribution of the string lengths in col1. The solution must not affect the size of the model.
What should you do?
You need to create a calculated column to display the month based on the reporting requirements. Which DAX expression should you use?
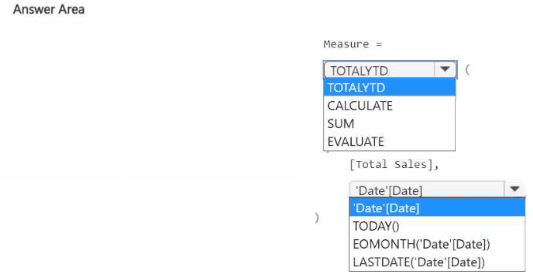
You have a Power Bl report that contains a measure named Total Sales.
You need to create a new measure that will return the sum of Total Sates for a year up to a selected date. How should you complete the DAX expression? To answer, select the appropriate options in the answer area.
NOTE: Each correct selection is worth one point.

You build a report about warehouse inventory data. The dataset has more than 10 million product records from 200 warehouses worldwide. You have a table named Products that contains the columns shown in the following table.
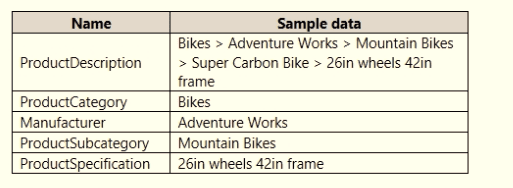
Warehouse managers report that it is difficult to use the report because the report uses only the product name in tables and visuals. The product name is contained within the ProductDescription column and is always the fourth value.
You need to modify the report to support the warehouse managers requirement to explore inventory levels at different levels of the product hierarchy. The solution must minimize the model size.
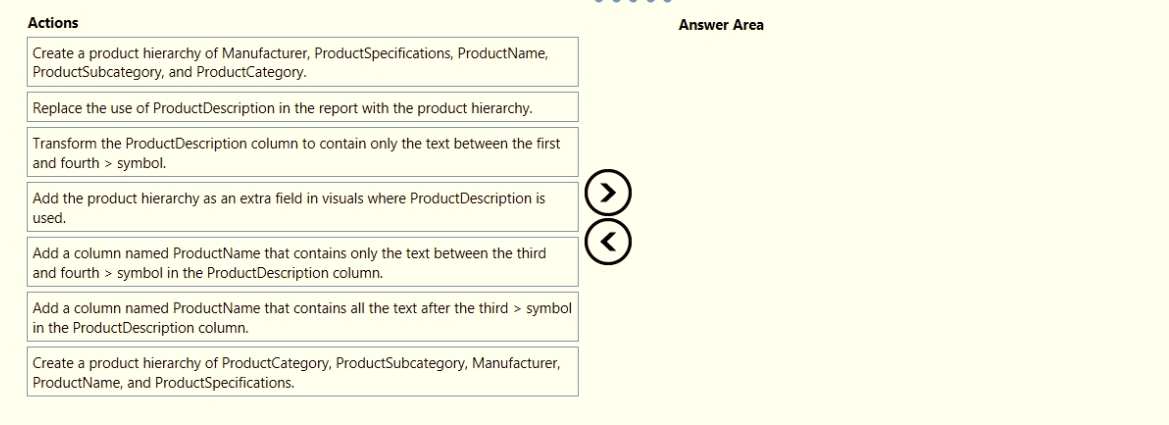
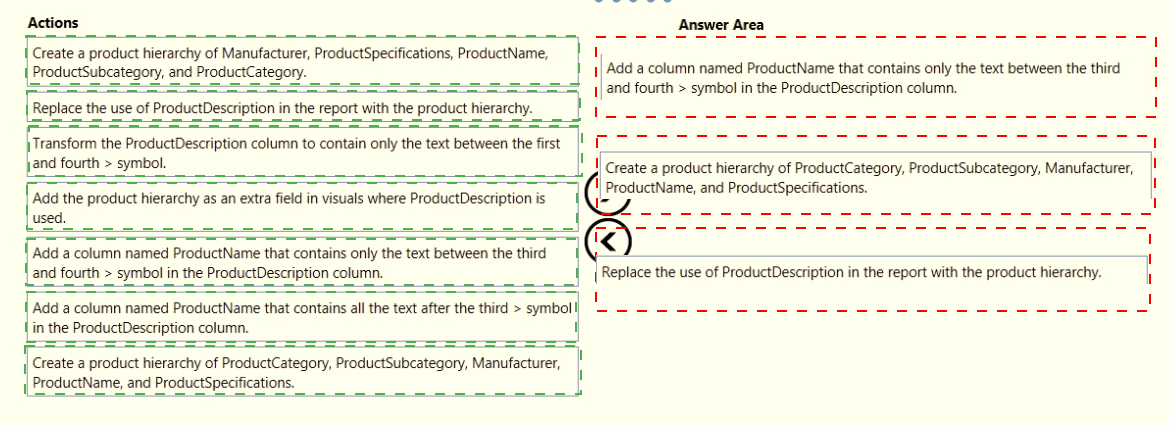
Which three actions should you perform in sequence? To answer, move the appropriate actions from the list of actions to the answer area and arrange them in the correct order.
You merge data from Sales.Region, Region_Manager, Sales_Manager, and Manager into a single table named Region. What should you do next to meet the reporting requirements of the executives?
