Microsoft PL-300 - Microsoft Power BI Data Analyst
You need to create a solution to meet the notification requirements of the warehouse shipping department.
What should you do? To answer, select the appropriate options in the answer area.
NOTE: Each correct select is worth one point:


You need to design the data model to meet the report requirements.
What should you do in Power BI Desktop?
You need to create the relationship between the product list and the revenue results. The solution must minimize the time it takes to render visuals.
What should you set as the relationship cardinality?
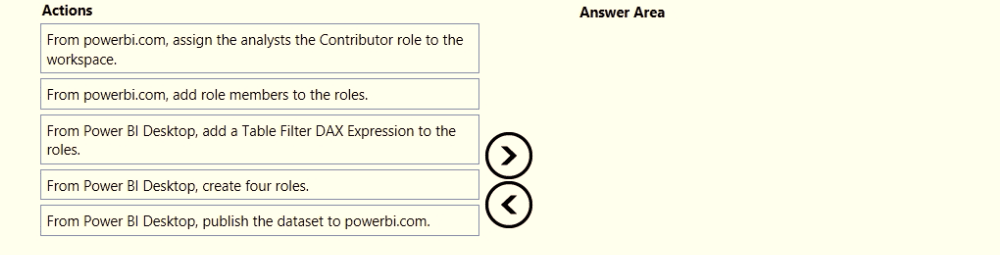
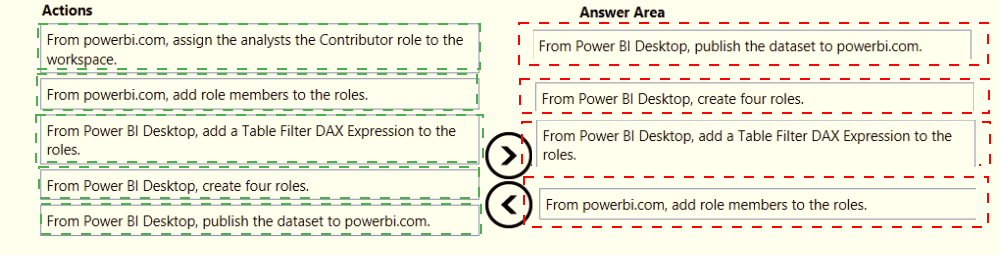
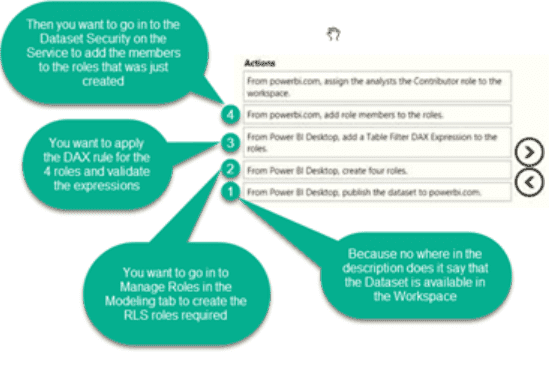
Once the profit and loss dataset is created, which four actions should you perform in sequence to ensure that the business unit analysts see the appropriate profit and loss data? To answer, move the appropriate actions from the list of actions to the answer area and arrange them in the correct order.
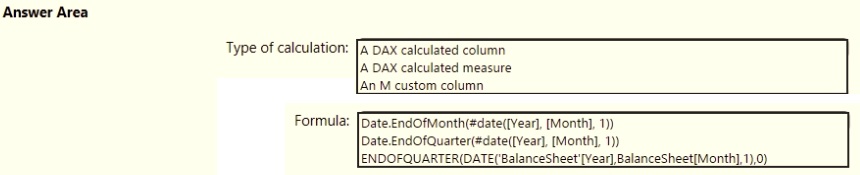
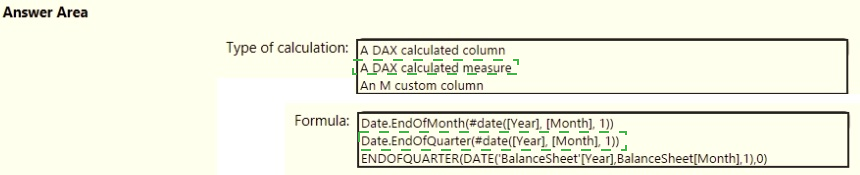
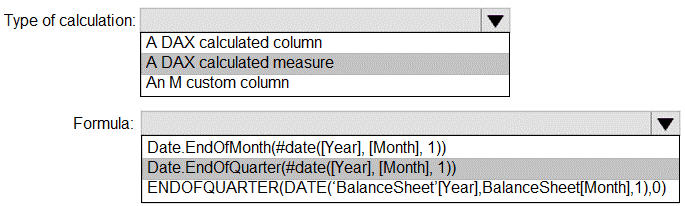
You need to calculate the last day of the month in the balance sheet data to ensure that you can relate the balance sheet data to the Date table. Which type of calculation and which formula should you use? To answer, select the appropriate options in the answer area. NOTE: Each correct selection is worth one point.
You need to ensure that the data is updated to meet the report requirements. The solution must minimize configuration effort.
What should you do?
How should you distribute the reports to the board? To answer, select the appropriate options in the answer area.
NOTE: Each correct selection is worth one point.
Which two types of visualizations can be used in the balance sheet reports to meet the reporting goals? Each correct answer presents part of the solution.
NOTE: Each correct selection is worth one point.
Which DAX expression should you use to get the ending balances in the balance sheet reports?
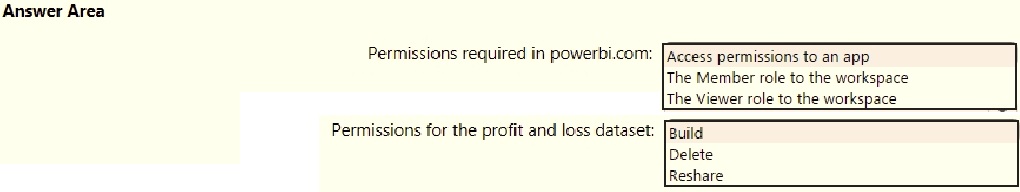
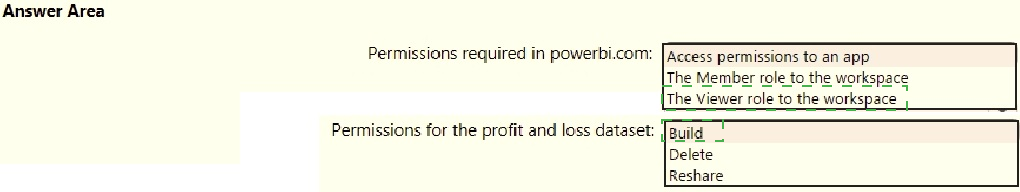
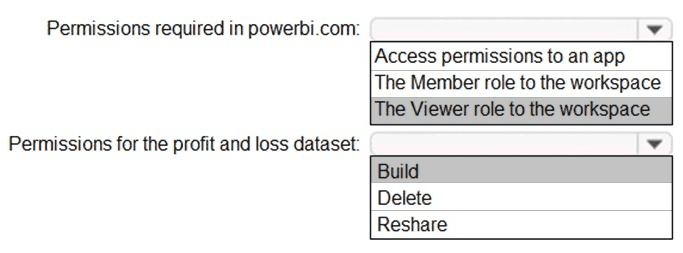
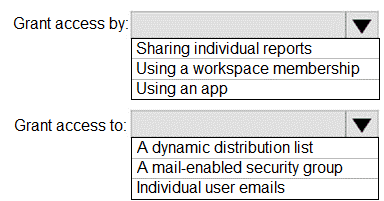
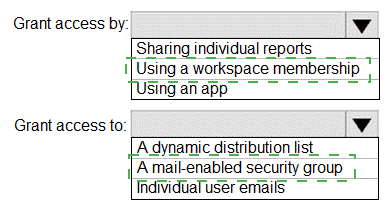
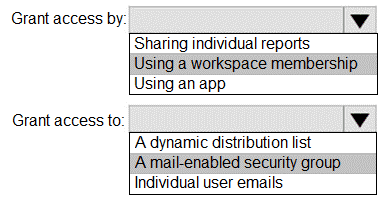
You need to grant access to the business unit analysts.
What should you configure? To answer, select the appropriate options in the answer area.
NOTE: Each correct selection is worth one point.