Summer Sale Limited Time 65% Discount Offer - Ends in 0d 00h 00m 00s - Coupon code: ecus65

Qlik QSBA2021 - Qlik Sense Business Analyst Certification Exam - February 2021 Release

Page: 1 / 2
Total 50 questions

A marketing team is using an app to analyze the company events. The team registers attendees with information such as an ID name and region and discusses business opportunities with attendees Opportunities are evaluated m time and set to a different status.

The team wants to use insight Advisor to query events and opportunities to:

• Review specific areas and periods

• Use marketing terms not currently present in the app when classifying opportunities

• Define calendar periods and add calculations for specific data fields

Some examples are as follows:

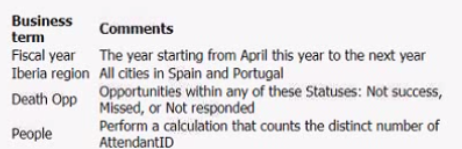
Which process should the business analyst follow?

A.

Add tags into the data fields to improve how the Insight Advisor identifies the fields when using the natural language queries Use the Selection tool to remove any tads not needed for the search results

B.

Define me business logic and vocabulary to define values using the fields m me data set Create groups and set properties in fields Use Calendar groups to define custom periods

C.

Create master dimensions and measures, including calendar measures to define fiscal periods Use tags to improve the insight Advisor search features and include vocabulary terms

D.

Update the data set using data manager or data load editor to include these terms as flags or values in the data set Also define the variable to determine which calculation should be used for each field

A business analyst wants to send an email to app users when the region's sales exceed $50,000. The notification must be delivered through a mobile app What should the business analyst configure?

A.

An email trigger on a data reload

B.

An action on the sheet containing the KPI

C.

A destination using Qlik NPrinting

D.

A condition using Qlik Alerting

A company CEO requests an app that contains global sales information. The CEO needs to present this information to an audience of international investors during an upcoming meeting

The presentation must meet several requirements

• Contain visualizations that present dearly to a large audience

• Answer audience questions dynamically

• Be made available as shared content

• Emphasize important sales revenue

Which Qlik Sense features must the business analyst prepare?

A.

Set up Nprinting to connect to the app and design a slideshow-style report

B.

Create a storytelling narration m a published app that contains embedded sheets

C.

Embed a video player m the shared app with a recording to describe the charts

D.

Create a sheet that features colorful and layered visualizations and export as a PDF

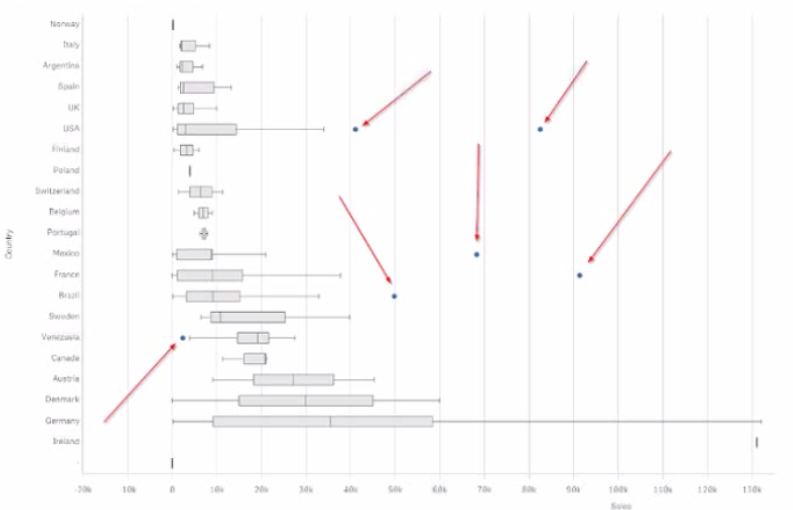
Refer to the exhibit

A business analyst is modifying a box plot End users report unexpected blue dots in a box plot

What should the business analyst do?

A.

Under Box plot elements, select Whisker length and increase to two interquartile ranges

B.

Under Box plot elements deselect Include outliers

C.

Under the Dimensions menu, deselect Include null values

D.

Ask the data architect to modify the data model

How does the Qlik Associative Engine analyze data from one or more data sources?

A.

Creates a set of pre aggregated queries for Qlik Sense to run

B.

Associates data into cubes to enable multidimensional analysis

C.

Inner joins multiple data sources together to remove unrequired information

D.

Combines multiple data sources without pre-aggregation

A business analyst is creating a new app with sales data.The visualizations must meet several requirements:

• A Bar chart mat shows sales by product group is used m multiple sheets

• A KPI object that visualizes that the total amount of sales is used once

• A Treemap mat shows margin by product group is used one time inside a Container

What should be added to the master items library?

A.

KPI

B.

Treemap

C.

Bar chart

D.

Container

A business analyst needs to create a master item from an object m an app After right-clicking the object the analyst notices the Add to master Items option is NOT available.What should the business analyst do to fixthis issue?

A.

Remove the master items tag

B.

Unlock the object

C.

Unlink the object

D.

Disable chart suggestions

A business analyst needs to share a link to a specific visualization with colleagues

Which steps should the business analyst use?

A.

1. Go to the OMC and select App Object

2. Right-click the correct visualization to get the URL

3. Share the URL with colleagues

B.

1. Go to the Dev Hub and select Single Configurator

2. Select Add data

3. Copy the URL from the browser and share with colleagues

C.

1. Right-click the visualization and select Share

2. Select Embed

3. Copy the URL and share with colleagues

D.

1. Right-click the visualization and select View data

2. Select Export data

3. Share the provided link with colleagues

To improve efficiencies a hospital mustanalyze how often a surgery is started late by operating room and surgeon The business analyst must consider several factors

• Dates of each surgery

• Number of minutes the start of the surgery is delayed

• Operating room

• Surgeon name

Which visualization should the business analyst use to meet these requirements?

A.

A combo chart that shows total minutes of delayed starts by operating room and surgeon

B.

A bar chart with total minutes of delayed starts and a drill-down from operating room to surgeon

C.

A scatter plot with delayed start minutes per day operating room and surgeon

D.

A line chart with total minutes of delayed starts and a drill-down from operating room to surgeon

A business analyst needs to develop a visualization that compares performances of every product the company sells and each product category. The CEO wants to highlight the worst- and best-performing products and categories in a meeting that beg/is in one hour Using a bar chart which two approaches should the business analyst use? (Select two.)

A.

Alternative dimensions using fixed number limitations

B.

Stacked bar chart using ColorMix function

C.

Stack dimensions and color by measure

D.

Alternative dimensions and diverging color scheme

E.

Stack dimensions and color by dimension