

Qlik QSBA2024 - Qlik Sense Business Analyst Certification Exam-2024
A business analyst needs to rapidly prototype an application design for a prospective customer. The only dataset provided by the customer contains 30 fields, but has over one billion rows. It will take too long to keep loading in its entirety while the analyst develops the data model.
Which action should the business analyst complete in the Data manager?
Refer to the exhibit.
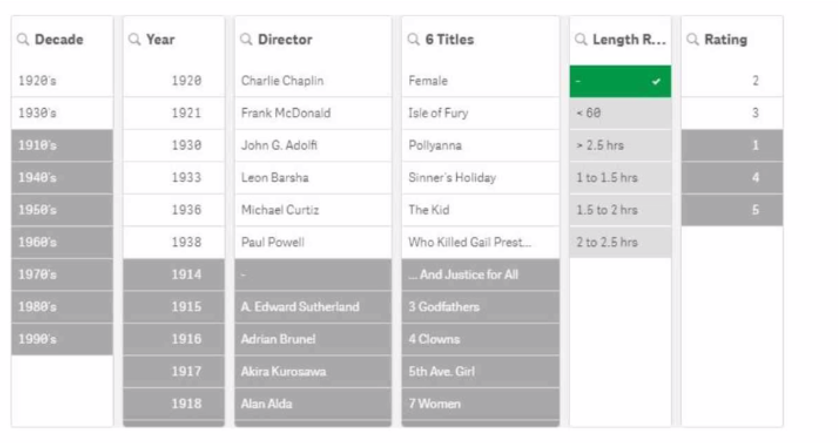
A movie analyst is using an app to gain insights into films created in the early 20th century. The analyst reviews the filter for Length Range, notices a hyphen "-", and selects it.
What can the analyst determine from the resulting filter panes?
The business analyst creates one table by concatenating and joining several source tables. This has resulted in a table of several thousand rows that may have several columns containing between 30% and 70% null values. The business analyst needs to understand the level of null values in each field of this table to determine if this is an issue.
Which capability should the business analyst use?
A company CEO requests an app that contains global sales information. The CEO needs to present this information to an audience of international investors during an upcoming meeting.
The presentation must meet several requirements:
• Contain visualizations that present clearly to a large audience
• Answer audience questions dynamically
• Be made available as shared content
• Emphasize important sales revenue
Which Qlik Sense features should the business analyst prepare?
A business analyst needs to create two side-by-side charts for a sales department with the following data:
• Number of orders
• Name of the customer
• Percentage of margin
• Total sales
The charts use a common dimension, but each chart has different measures. The analyst needs to create a color association between the two charts on the dimension values.
Which action should the business analyst take?
A banking organization needs a dashboard that shows the following:
• A KPI indicator for current year (CY) versus last year (LY) revenue
• A scatter plot that shows the cost versus revenue of product categories
• A treemap that shows average customer satisfaction rating based on regions
• A table that shows CY cost by record number, financial instrument, and bank
In addition to the customer satisfaction rating, which fields should be used to create the required measures?
A business analyst is developing an app that contains a data model with fields: Country, City, Sales, ProductName, and ProductCategory. The global sales manager wants to add new visualizations to this app.
The business analyst must include the following:
• Ability to dynamically change the number of countries and cities
• Display a maximum of 10 countries
• Display a maximum of 5 cities per country
Which steps should the business analyst take?
A business analyst is developing an app that requires a complex visualization. The visualization is very similar in style and configuration to another visualization in a different app, but the data models are completely different.
Which action should the business analyst take to most efficiently create the new visualization?
A business analyst needs to create a visualization that compares two measures over time using a continuous scale that includes a range. The measures will be Profit and Revenue.
Which visualization should the business analyst use?
A business analyst created a visualization that has a color indicator when an order is below a certain fixed profit threshold. This visualization now needs to change so that the threshold can be defined by the user. The user base is approximately 1000 heavy Excel users. These thresholds will be defined by each user somewhat frequently, although the data changes only once per day.
Which action should the business analyst take to update this visualization?
