The correct answer is D. Mean (Transformation).
According to the web search results, a mean transformation is an analytic function that returns the average value of a metric or a dimension over a specified time interval1. A mean transformation can be used to smooth a very spiky metric, such as cpu.utilization, by reducing the impact of outliers and noise. A mean transformation can also help to see if the metric is trending up or down over time, by showing the general direction of the average value. For example, to smooth the cpu.utilization metric and see if it is trending up over time, you can use the following SignalFlow code:
mean(1h, counters(“cpu.utilizationâ€))
This will return the average value of the cpu.utilization counter metric for each metric time series (MTS) over the last hour. You can then use a chart to visualize the results and compare the mean values across different MTS.
Option A is incorrect because rate/sec is not an analytic function, but rather a rollup function that returns the rate of change of data points in the MTS reporting interval1. Rate/sec can be used to convert cumulative counter metrics into counter metrics, but it does not smooth or trend a metric. Option B is incorrect because median is not an analytic function, but rather an aggregation function that returns the middle value of a metric or a dimension over the entire time range1. Median can be used to find the typical value of a metric, but it does not smooth or trend a metric. Option C is incorrect because mean (by host) is not an analytic function, but rather an aggregation function that returns the average value of a metric or a dimension across all MTS with the same host dimension1. Mean (by host) can be used to compare the performance of different hosts, but it does not smooth or trend a metric.
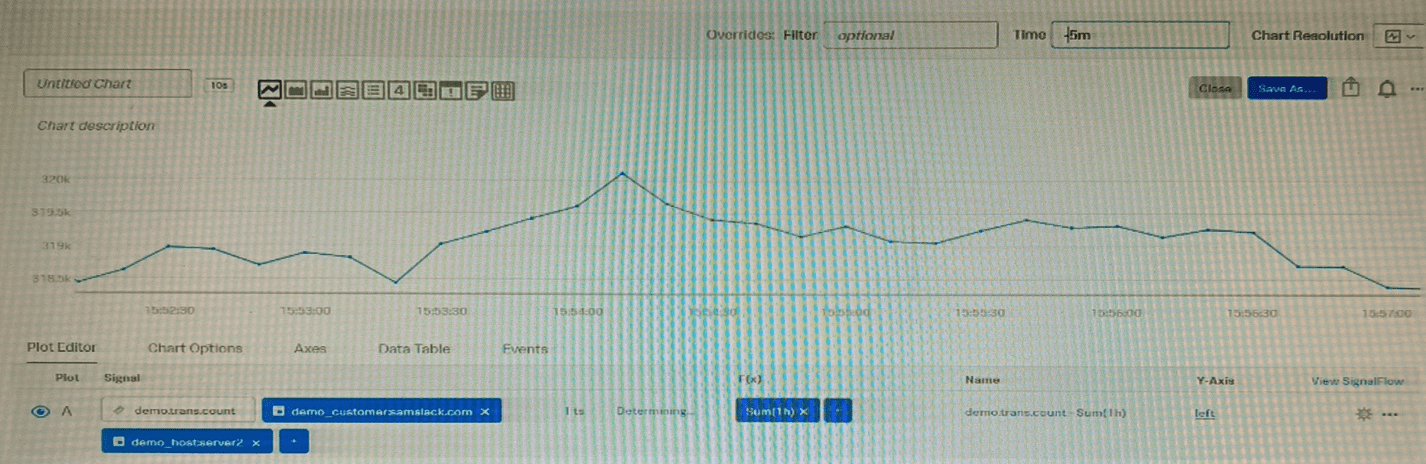
Mean (Transformation) is an analytic function that allows you to smooth a very spiky metric by applying a moving average over a specified time window. This can help you see the general trend of the metric over time, without being distracted by the short-term fluctuations1
To use Mean (Transformation) on a cpu.utilization metric, you need to select the metric from the Metric Finder, then click on Add Analytics and choose Mean (Transformation) from the list of functions. You can then specify the time window for the moving average, such as 5 minutes, 15 minutes, or 1 hour. You can also group the metric by host or any other dimension to compare the smoothed values across different servers2
To learn more about how to use Mean (Transformation) and other analytic functions in Splunk Observability Cloud, you can refer to this documentation2.
1: https://docs.splunk.com/Observability/gdi/metrics/analytics.html#Mean-Transformation 2: https://docs.splunk.com/Observability/gdi/metrics/analytics.html