

Tableau TDA-C01 - Tableau Certified Data Analyst Exam
A Data Analyst has two tables named EmployeeInfo and DepartmentInfo. EmployeeInfo contains four fields named Full Name, Department ID, Start Date, and Salary. DepartmentInfo contains four fields named Department Name, Size, Department ID, and VP. The analyst wants to combine the tables to meet the following requirements:
EmployeeInfo is the first table that is dragged to the canvas,
The records must contain the Full Name, and the Department Name, Size, and VP fields if available,
Not all records have an exact match.
Which type of join should the analyst use?
A Data Analyst creates the following story that contains two story points.
The analyst wants to change the story point format to show the current story point number out of the total number of story points.
Which Layout option should the analyst use?
You want to show the cumulative total of each year for every state.
Which quick table calculation should you use?
You have a sales dataset that contains the following fields.
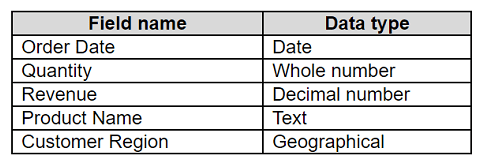
You need to analyze the average revenue per product in different regions over time.
Which two fields should be measures? Choose two.
You have the following calculated fields in a worksheet.
[Calc1] = DATEADD ('year', -1, TODAY ())
[Calc2] = DATETRUNC ( 'month' , DATEADD ('year', -1, TODAY ())
You want to calculate the month to date value of the prior year.
How should you complete the formula? (Drag the appropriate Options to the Answer Area and drop into the correct locations.)
You have a Tableau workbook.
You want to make the workbook available in Tableau Online.
What should you do?
You have the following dataset:
You want to create a parameter to dynamically filter the data to produce the following results.
Which two types of parameters can you use to produce the results? Choose two.
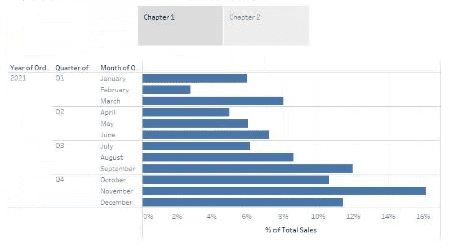
Open the link to Book1 found on the desktop. Open the CategoryPercentage worksheet.
Modify the bar chart show the percentage of sales for each Subcategory within every Category. The total percentage for every Category must be 100%.

Open the link to Book1 found on the desktop. Use the Superstore data source.
Split the Customer Name field into two fields named First Name and Last Name.
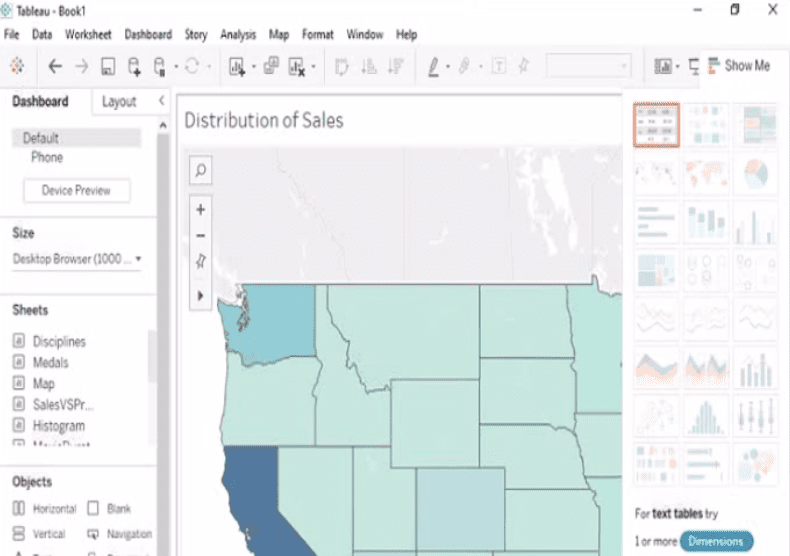
Open the link to Book1 found on the desktop. Open the Movie Durations worksheet.
Replace the existing data source with the Netflix_2019 data source.
