

Tableau TDA-C01 - Tableau Certified Data Analyst Exam
You have the Mowing dashboard.
Which two elements are floating? Choose two.
A colleague provides you with access to a folder that contains the following files:
• Sates.csv
• Bookl.twb
• Sates.hyper
• Export.mdb
Which He contains an extract?
You have the following dataset.
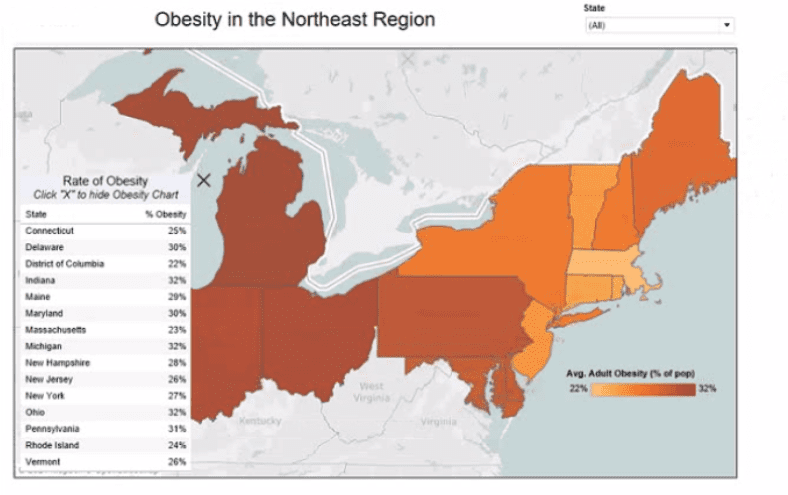
You need to create the following worksheet.
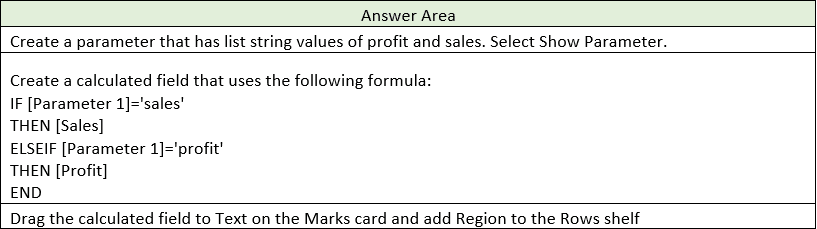
The table must show either profit or sales based on the selection from the Parameter 1 menu.
Which three actions should you perform in orders
(Place the three correct options in order Use the arrows to move Options lo Answer Area Use Answer Area arrows to reorder the options)
 A screenshot of a computer
Description automatically generated
A screenshot of a computer
Description automatically generatedYou plan to create a visualization that has a dual axis chart. The dual axis chart will contain a shape chart and a line chart will use the same measure named Population on the axis.
You need to configure be shapes to be much larger than the line.
What should you do?
You have a dashboard that contains confidential information about patients health. The data needs to always be up to date tor a team of healthcare workers How should you share me dashboard with the healthcare workers?
You have the following dataset.
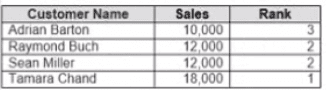
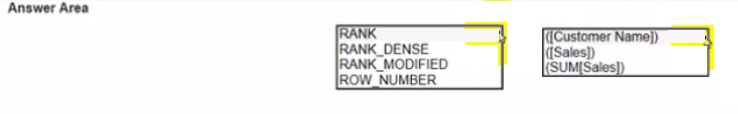
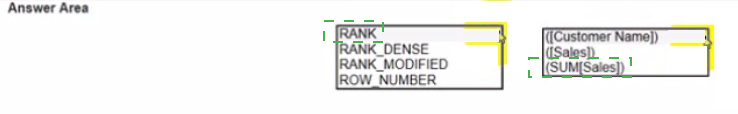
Yon need to calculate the ranking shown in the Rank field.
How should you complete the formula? (Use the dropdowns in the Answer Area to select the correct options to complete the formula ?
You have the following dashboard that contains two visualizations.
You want to show only one visualization at time. Users must be able to switch between visualizations.
What should you me?
You have the following dataset.
Which Level of Detail (LOD) expression should you use to calculate tie grand total of all the regions?
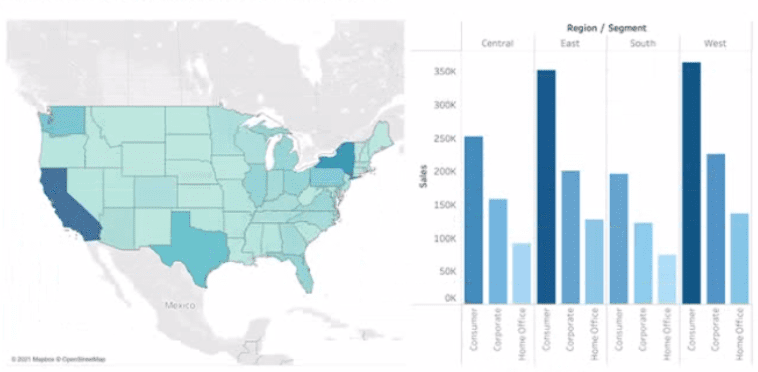
You have a database that includes field named sales, City and Region.
You have the following chart that shows the number of sales made in different cities.
You want to dynamically show the corresponding region when users hover their mouse over any of the bars.
What should you do?
A Data Analyst has a data source that contains the following columns:
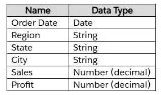
he analyst has the following FIXED Level of Detail (LOD) expression called Region Sales:
{ FIXED [Region] : SUM([Sales]) }
The analyst has a view that has a dimension filter on the State column to exclude five states.
What should the analyst do to ensure the five states are also excluded from the LOD expression?
