

Tableau TDA-C01 - Tableau Certified Data Analyst Exam
You have the following data source in tableau Server.
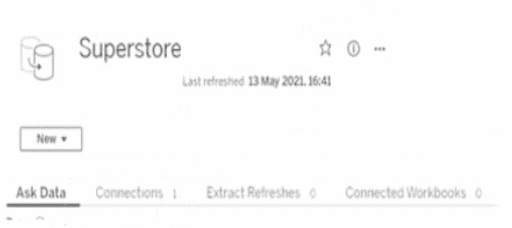
You need to ensure that the data is updated every hour.
What should you select?
You want to connect a Tableau workbook to a dataset in a Microsoft Excel spreadsheet.
What should you do from Tableau Desktop?
You have the following line chart that shows the average sales by month.
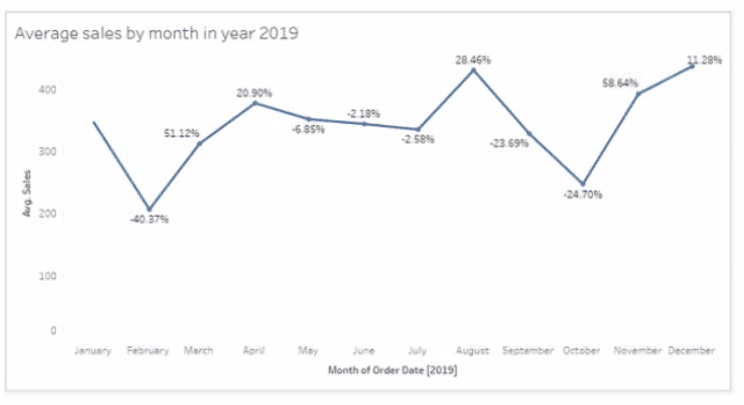
Which month had the biggest increase in swage sales compared to me previous month in 2019?
You have the following box plot that shows the distribution of average profits made in every state by region.
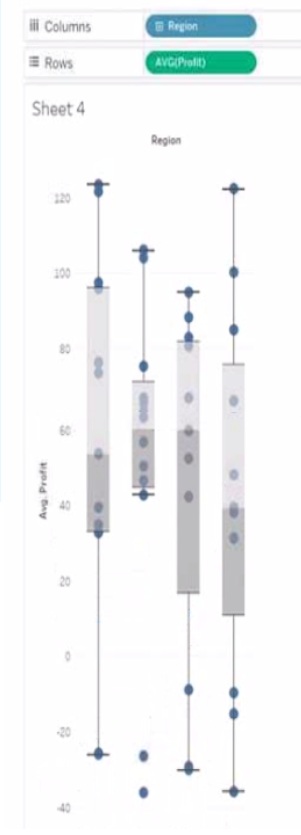
Which region has the smallest distribution of profits?
You have the following tiled dashboard that has one sheet.
You want to replace the sheet with Sheet2.
What should you do?
You have a line chart on a worksheet.
You want to add a comment to March 2020 as shown in the following visualization.
What should you do?
