

Tableau TDS-C01 - Tableau Desktop Specialist
Which chart type uses automatically generated sizes that cannot be resized by using the Marks card?
Which aggregation is available without requiring a table calculation or calculated field?
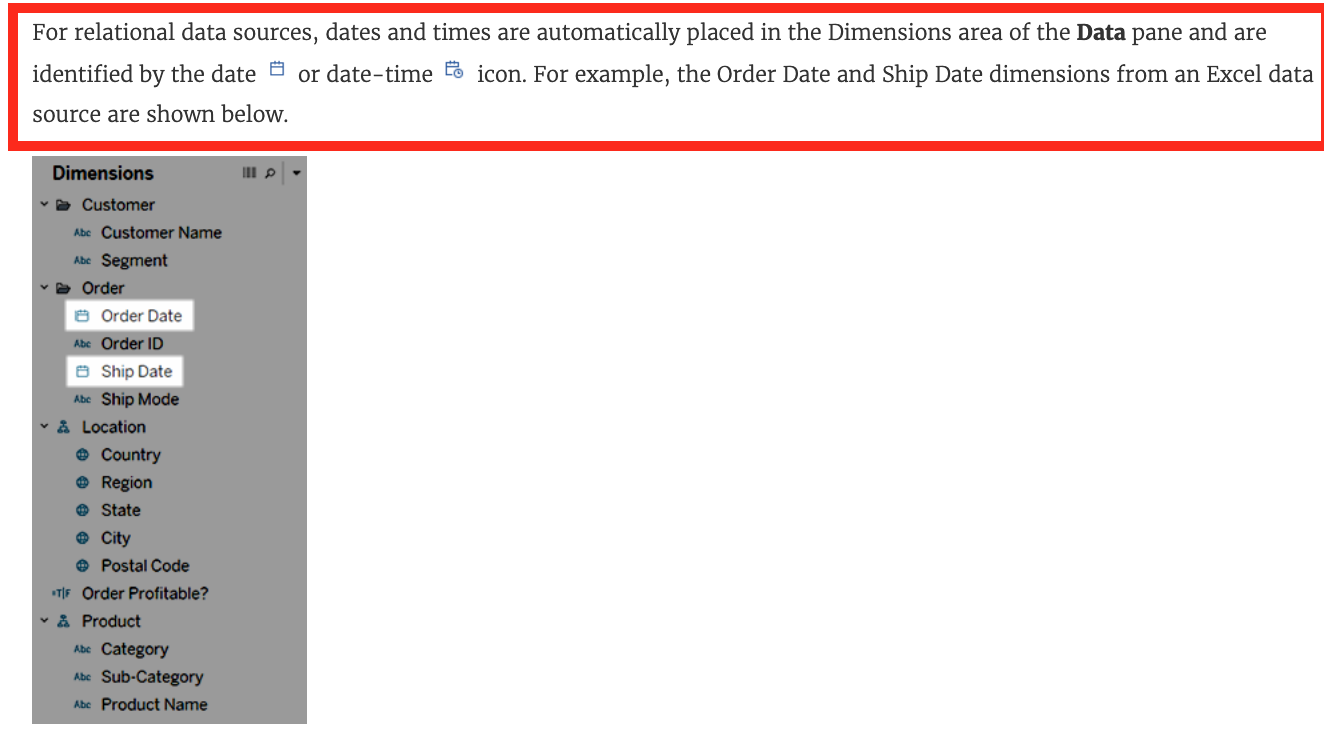
Which of the following are true about dimensions?
Which of the following are compelling reasons to use a Stacked Bar Chart?
You need to uniformly change the size for all marks in a view.
What should you do?
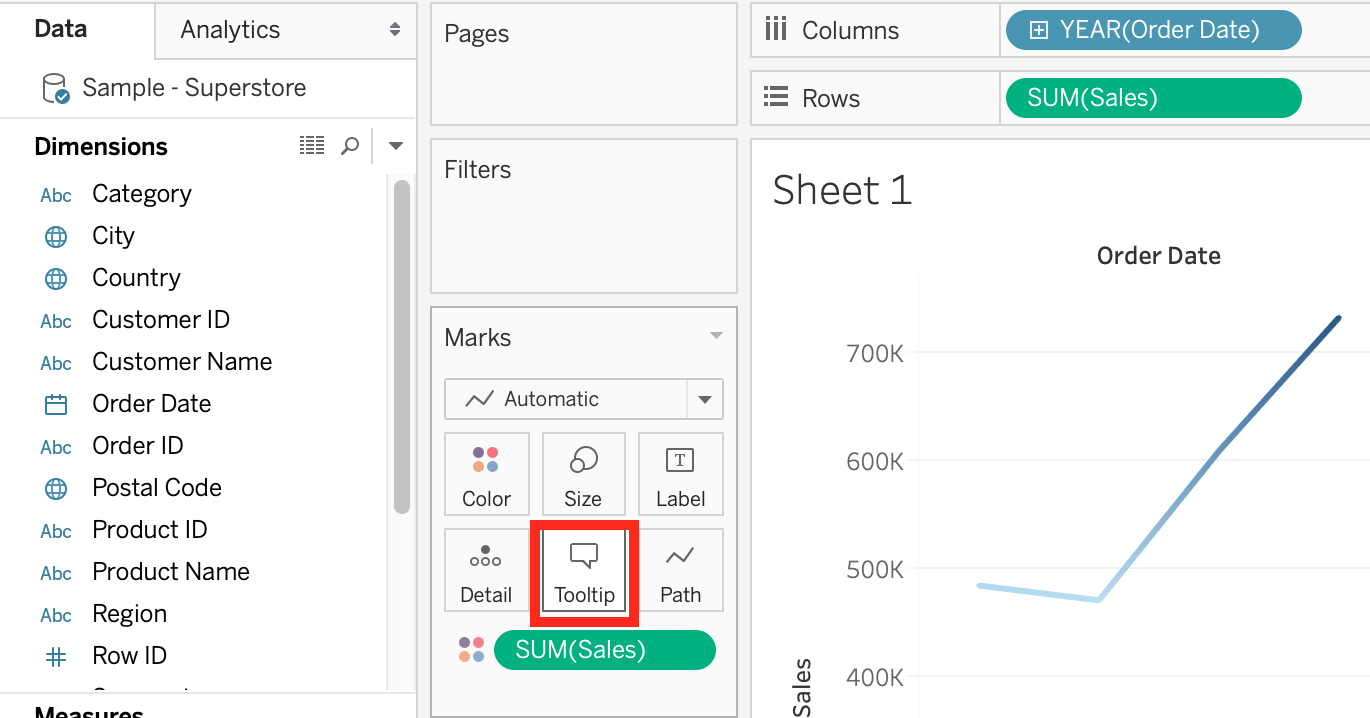
Which of the following are valid ways to Bold the Tooltip content in Tableau?
 Graphical user interface, application
Description automatically generated
Graphical user interface, application
Description automatically generated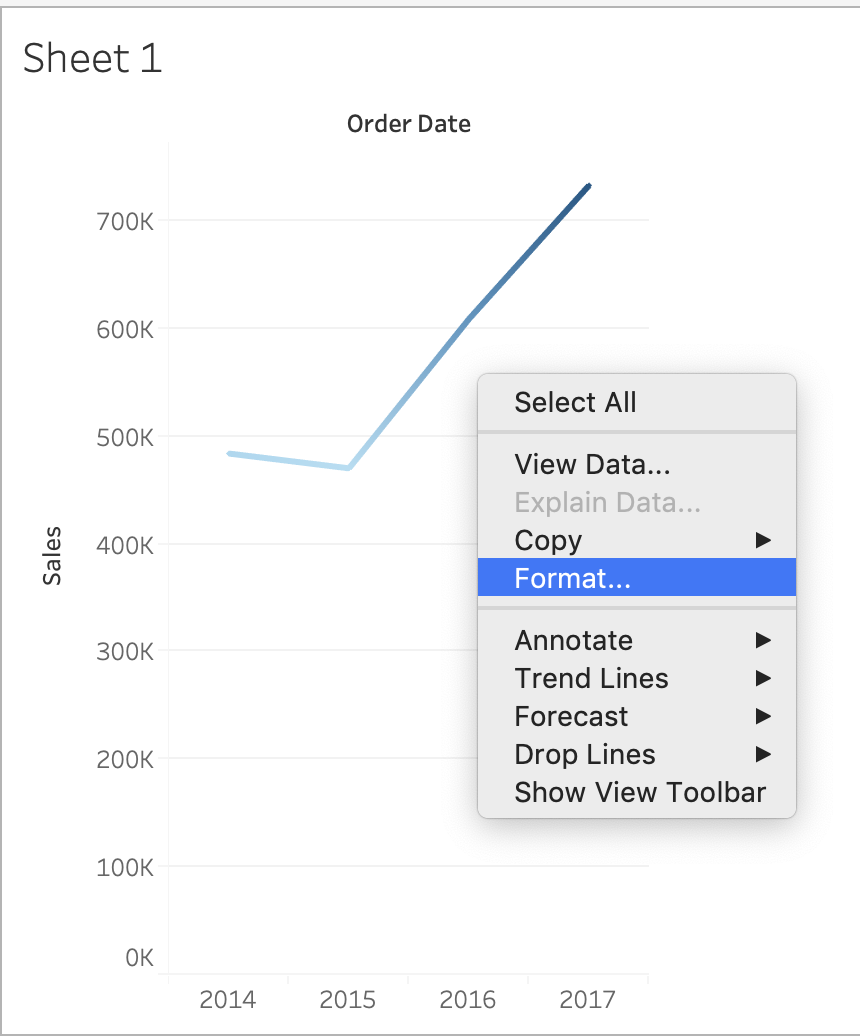 A picture containing line chart
Description automatically generated
A picture containing line chart
Description automatically generated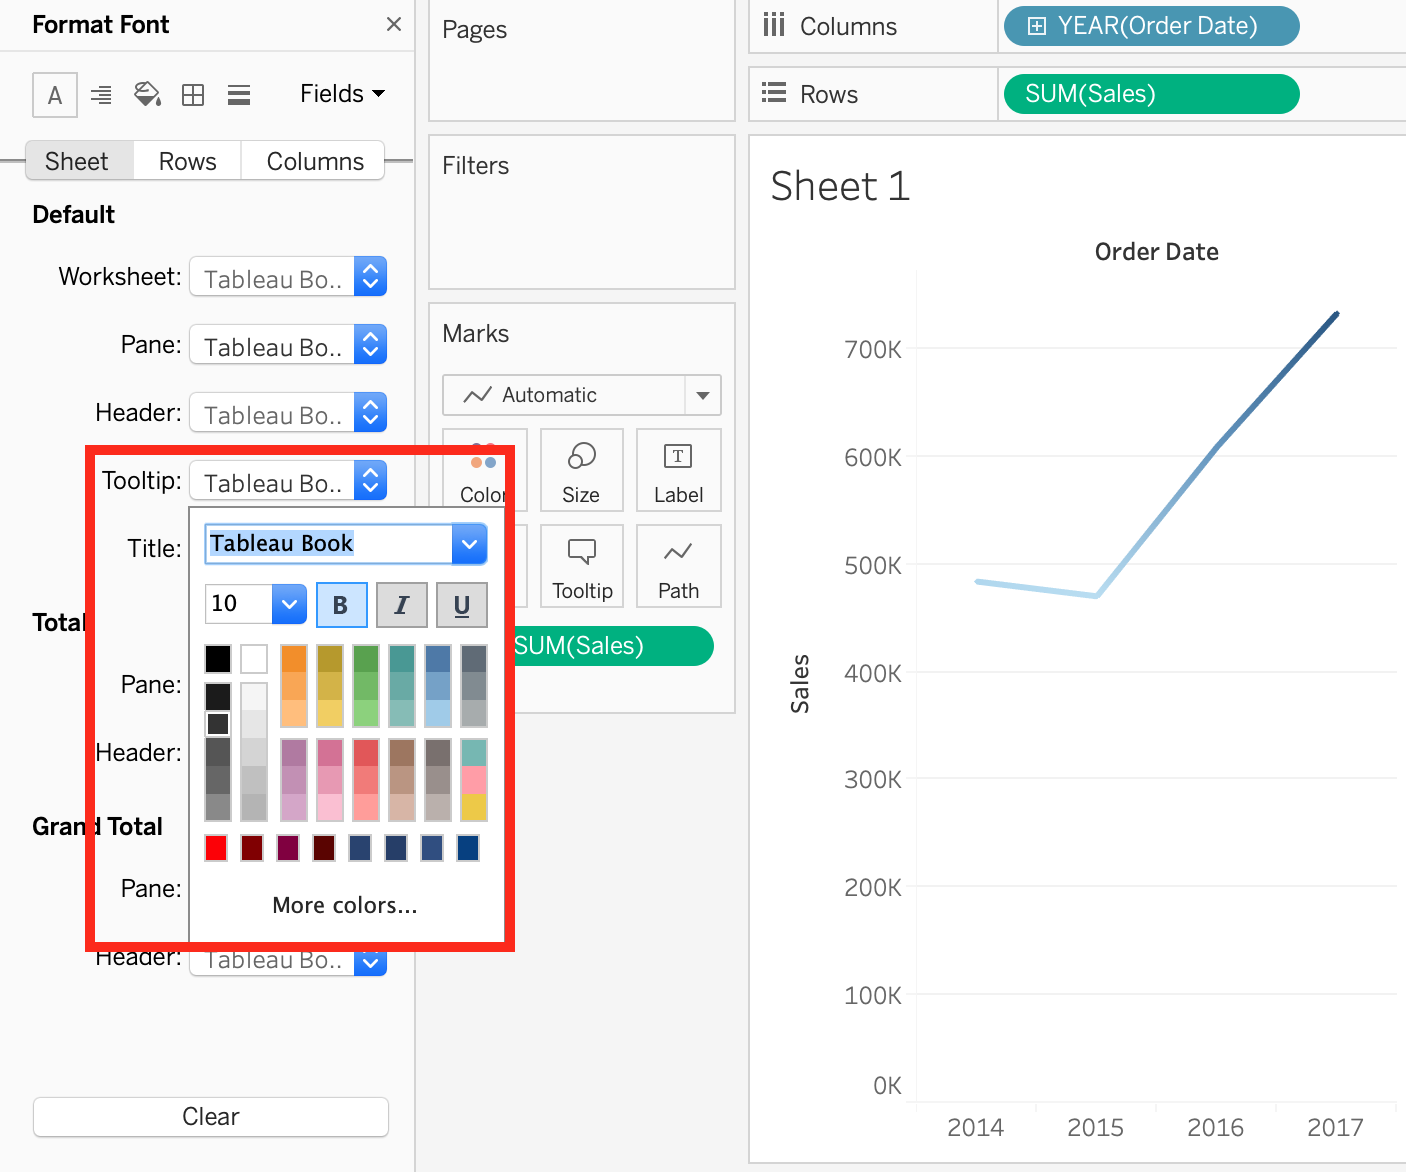 Graphical user interface
Description automatically generated
Graphical user interface
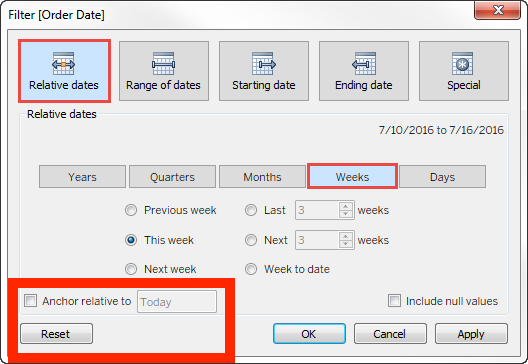
Description automatically generatedFor a relative date filter, the default anchor is _________________
Question 45: Skipped
You have just created a histogram and now want to be able to change the size of bins dynamically. Using which of the following will easily satisfy your requirement?
Using the Geo Data table, create a Bar chart showing the In-Stock percentage for each Color. What is the Average In-Stock percentage for the Color Red? Present your answer correctly upto 2 decimal places.
